This page will be discontinued on April 1, 2023. For more information on how CO-OPS monitors storm surge during tropical cyclones, please bookmark https://tidesandcurrents.noaa.gov/inundationdb_info.html.
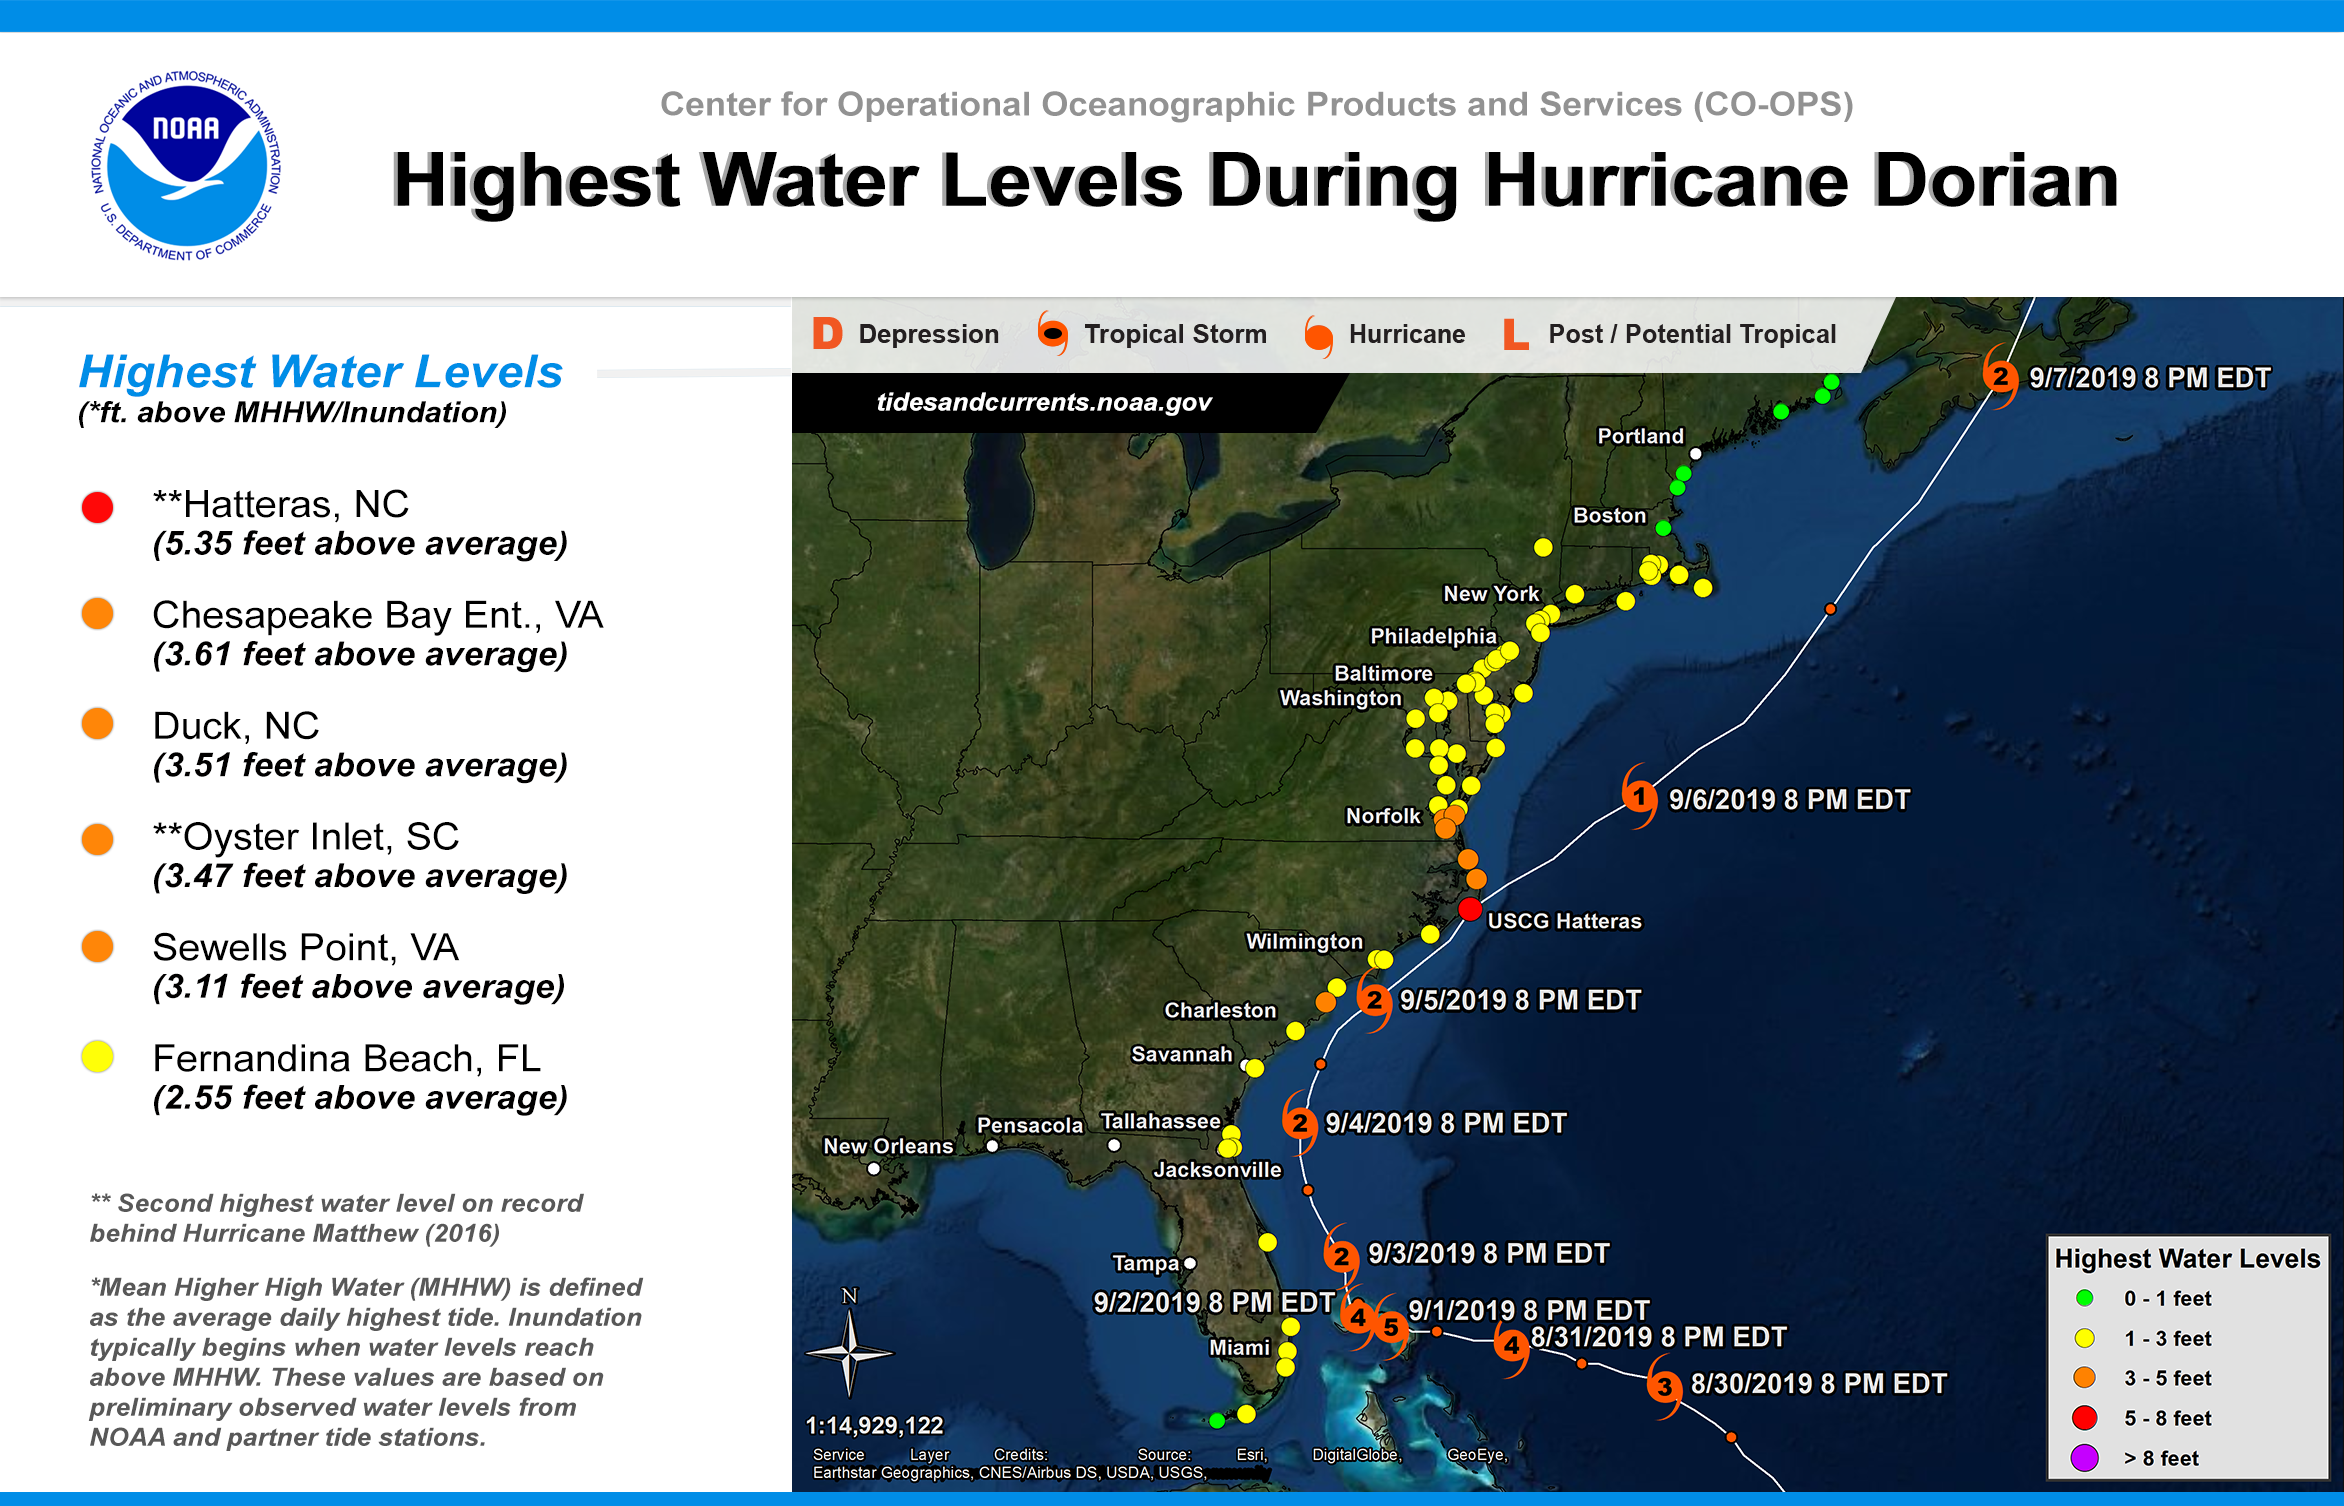
Highest Storm Water Levels
This graphic depicts highest water levels along the coast throughout the duration of this storm event. Highest water levels are measured in feet above Mean Higher High Water (MHHW). MHHW is defined as the average daily highest tide. Inundation typically begins when water levels exceed MHHW.
These values are based on preliminary observed water levels from NOAA and partner tide stations. Verified water level data should be available within a month of the event and can be provided upon request.
Storms By Year
Click on a link below to view an info-graphic highlighting peak water levels for that storm.
2019 2017 2016