Coastal Inundation Dashboard
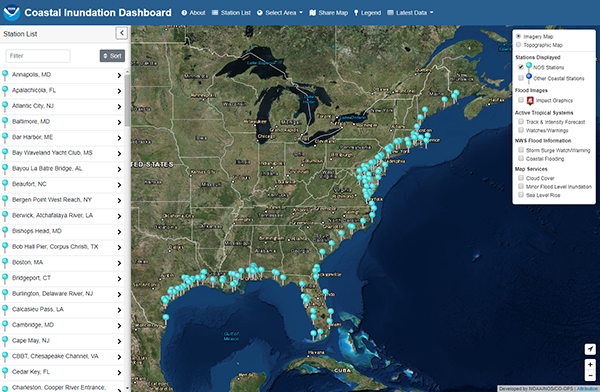
A map showing stations with real-time and historical water level information.
The Coastal Inundation Dashboard provides real-time, projected, and historical water level information at over 200 National Ocean Service water level stations positioned across the U.S. and its territories. Users can access this information to understand near-term flood risks, such as impacts from tropical cyclones or nor’easters, and long-term inundation risks, such as high-tide flooding and sea level rise. The product supports coastal flood planning, response, and mitigation across timescales.
Launch the Dashboard here or download the data via the CO-OPS API builder.
The Coastal Inundation Dashboard is an interactive decision-support tool that provides real-time and forecast water levels, and historic flooding information at National Ocean Service (NOS) water level stations across the U.S. and its territories. The product features both map-based and detailed station views, allowing users to view flooding information across spatial scales.
The Dashboard supports planning, response, and mitigation in response to coastal flooding by allowing users to:
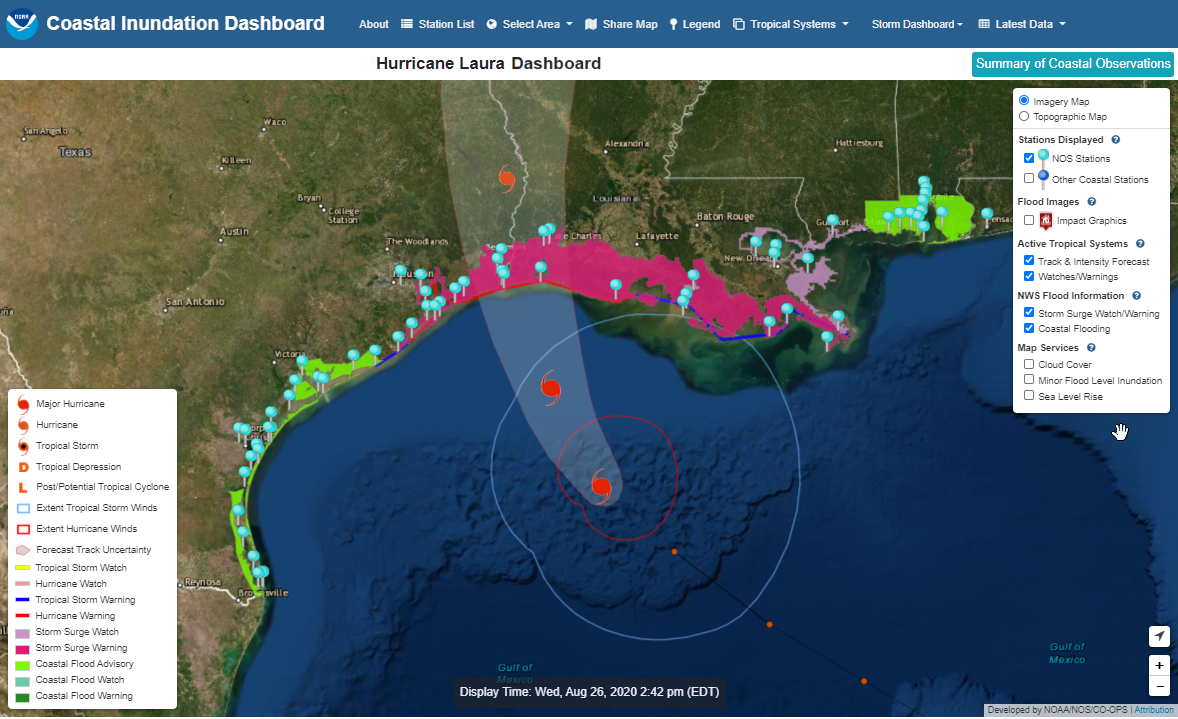
- Monitor water levels at specific locations to track real-time observations in the path of a hurricane, nor’easter, or other coastal storm.
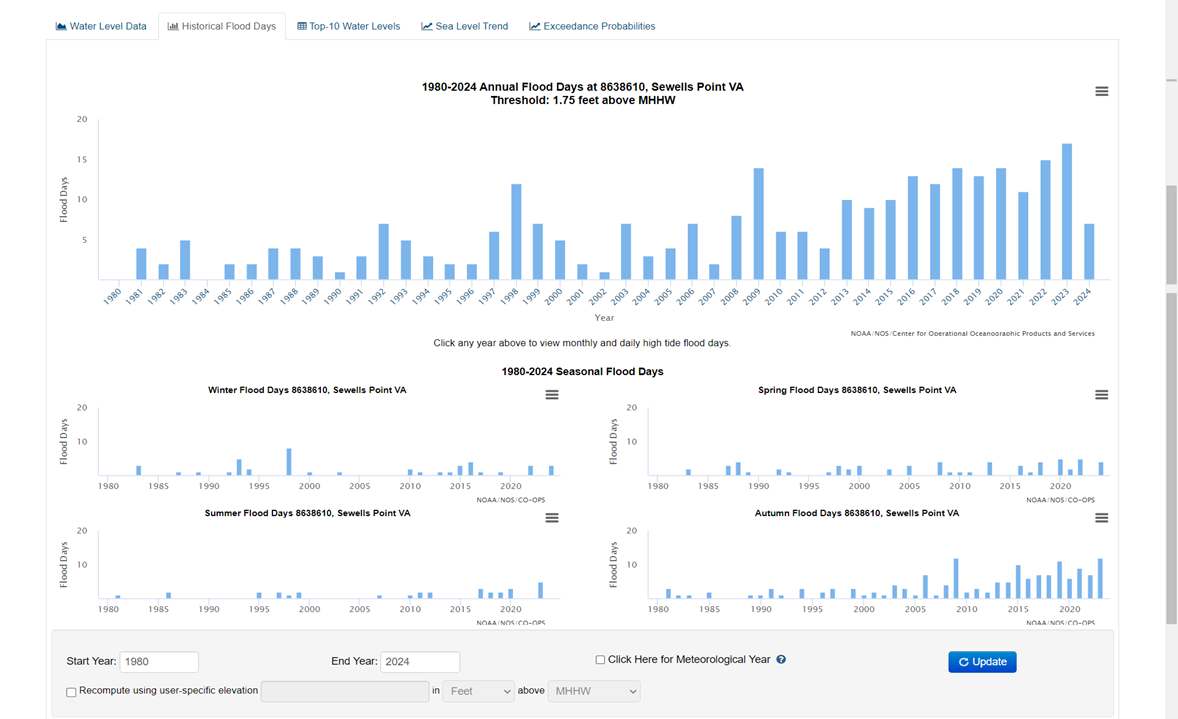
- Examine historical flood days and top-ten peak observed water levels to assess increases in flood frequency due to sea level rise.
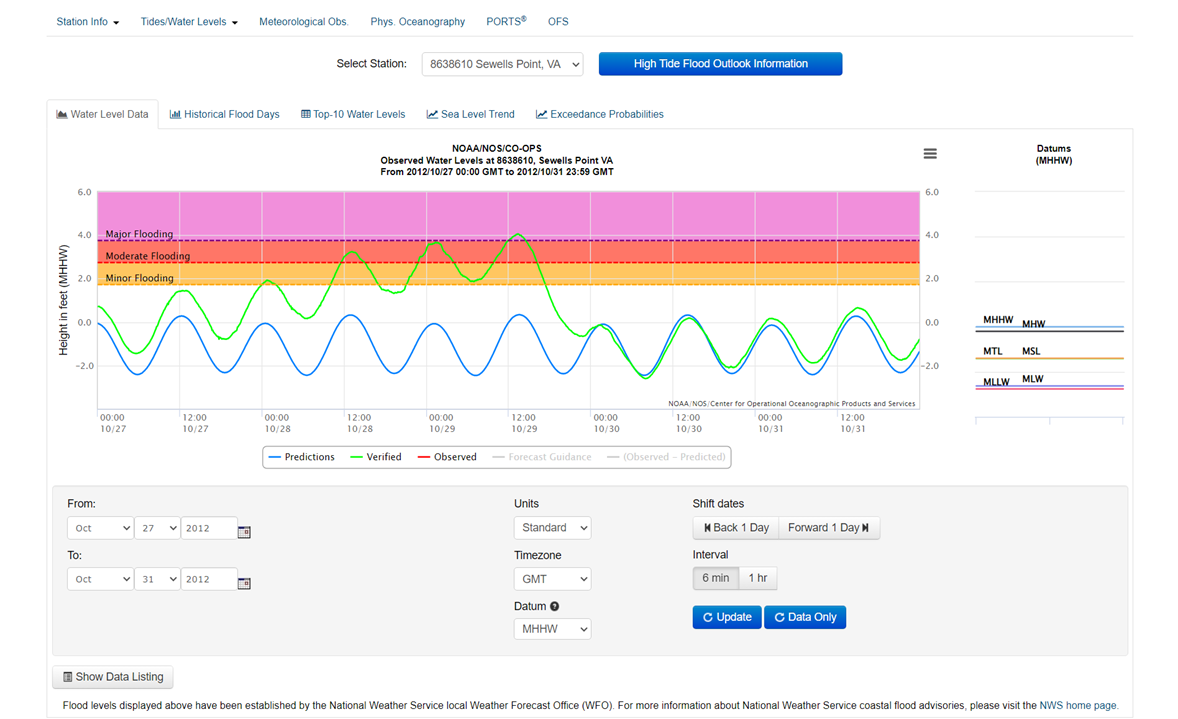
- View 48-hour water level forecasts and daily flood likelihood information at many locations to evaluate near-term flood vulnerability.
During tropical cyclones and other significant coastal storms that impact the U.S. coast, CO-OPS will stand up a custom storm dashboard that will be linked from CO-OPS' main website. This dashboard will, by default, display storm information such as the latest National Hurricane Center tropical cyclone forecast including track, cone of uncertainty and wind extent, along with areas under a storm surge or coastal flood watch or warning. This custom dashboard provides a one-stop-shop for monitoring a storm's impact to coastal water levels and will be updated multiple times a day while the storm remains a threat to the U.S.
Inundation is the amount of water that occurs above normally dry ground as a result of flooding. Along the coast, there are a few common sources of inundation including abnormally high tides, storm surge, persistent onshore winds and waves. In rivers and tidal estuaries, runoff from excessive rainfall can provide another source of inundation. Altogether these factors, including tides, constitute the total water level.
Inundation is most commonly referenced to the Mean Higher High Water (MHHW) tidal datum because land above MHHW is dry most of the time, providing users a good understanding of where flooding begins and serves as a good measure of how much additional water is present during an inundation event. In most locations across the U.S., a relationship exists between tidal datums and the land elevation.
Coastal Inundation Dashboard primarily uses NOAA’s National Water Level Observation Network (NWLON). The NWLON consists of over 200 long-term water level stations. Different types of sensors are used to measure water levels depending on the conditions at each location. Most locations along the coast utilize either an acoustic or microwave water level sensor as the primary sensor collecting data.
Acoustic sensors use the speed of sound to determine the water level. These sensors send an acoustic pulse (sound wave) from above the water’s surface through a sounding tube enclosed in a stilling well and measure the time it takes for the signal to bounce off the water’s surface and return to the sensor. The height of the water level can then be inferred from this time measurement.
Microwave sensors sit above the water’s surface, but do not require a protective enclosure. These sensors measure water levels by emitting a microwave pulse towards the water’s surface and measure the time it takes for the return pulse to reach the sensor. Similar to acoustic sensors, the water level height can be inferred based on the time it takes for the microwave pulse to return to the sensor.
Most stations have redundant (backup) sensors in the form of a Single Orifice Bubbler Strain Gauge Sensor to ensure continuous data. The bubbler sensors measure the pressure of the water column above the orifice, which can then be translated to a water level height using the water’s density. These backup sensors can be used to disseminate real-time water level information if the primary sensor is no longer measuring reliable data.
Specifications for the installation and maintenance of the gauges and the sensor performance specifications are available on CO-OPS’ publication’s page.
For forecasting purposes to ensure public safety, NOAA has established three flood severity thresholds at many water levels along the coast. The thresholds are based upon water level heights established by local National Weather Service (NWS) weather forecasting offices based on many years of impact monitoring. All thresholds were established by working with local emergency managers to determine the elevation water levels must reach for a given area to begin to be affected by flooding. The thresholds take into account local land cover, topography, the built environment, and human mitigation strategies.
Not all locations have an established flood threshold. At those locations, CO-OPS has derived thresholds based on the analysis detailed in NOAA Technical Report NOS CO-OPS 086 - Patterns and Projections of High Tide Flooding.
While specific impacts vary by location, a generalized summary is below.
Minor Impacts - Low threat of property damage and no direct threat to life.
Moderate Impacts - Elevated threat of property damage and some risk to life if one places themself in unnecessary danger.
Major Impacts - Significant threat to life and property.
Many National Weather Service forecast offices define local inundation impacts from these three thresholds (e.g. road closures, flooding of low level areas, etc.). An example of impacts for the New York City area provided by the Upton, NY forecast office can be found here. Please refer to your individual NWS weather forecast office for specific impact definitions for your area.
The NWS impact thresholds factor in local effects such as seawalls or very localized geography. However in order to compare inundation impacts over large geographic areas, each station has a separate minor flood threshold based on the analysis performed in NOAA Technical Report NOS CO-OPS 086 - Patterns and Projections of High Tide Flooding. These NOS minor flood thresholds are derived using a correlation that was found between the NWS minor flood thresholds and the mean difference between high and low tide at that location. In some instances the NOS minor flood threshold may be lower or higher than the NWS minor flood threshold. Since NOS thresholds are more consistent across geographical areas, these levels are used when examining historic water level data to determine the frequency of past and projected flood days.
Stations blinking on the map indicate that flooding may be occurring or is forecast to possibly occur over the next 48 hours. The specific cause is listed in the pop-up window when clicking on the station marker.
Observed water levels are compared with the NWS minor flood impact level as well as the NOS derived minor flood level (which can sometimes be slightly lower than the NWS level). If observed water levels exceed either of these flood levels, the station may be experiencing flooding. In cases where forecast data is available, this same comparison is made with forecast water levels. If water levels are forecast to exceed the minor flood level, the station may experience flooding over the next 48 hours (based on the forecast window).
The station markers will continue to blink until water levels have remained below the minor flood threshold for 13 consecutive hours and/or forecast water levels no longer exceed either minor flood threshold.
Geospatial (mapped) sea level rise information is taken from the NOAA Office of Coastal Management (OCM) Sea Level Rise Viewer. This application makes use of established relationships between tidal datums and land elevation. Using this relationship, you can apply a rise in sea level of 1 foot, 2 feet, etc. (representing a long-term anomaly such as sea level rise, or a short term anomaly such as storm surge) and subtract out the land elevation. Simply put, land areas that fall below the corresponding elevated water level selected will show as flooded, unless they are sheltered by surrounding elevations that are higher.
The water level forecasts are a result of NOS’ Operational Forecast System (OFS). These forecasts consist of the automated integration of observing system data streams, hydrodynamic model predictions, product dissemination and continuous quality-control monitoring. The OFS performs nowcast and short-term (0 hr. - 48 hr.) forecast predictions of several oceanographic parameters (e.g., water levels, currents, salinity, temperature, waves). The OFS models are run four times per day and generate 6-hour nowcasts and 48-hour forecast guidance. Select models such as those in the Great Lakes produce water level forecast guidance out to 120 hours. After each run of the OFS model the new forecast is updated and shown on the plot.
Coastal Inundation Dashboard Quick Start Guide
Coastal Inundation Dashboard User Guide