Annual High Tide Flooding Outlook
A map showing the number of high tide flooding days at National Water Level Observation Network stations observed or projected for the selected year. Flooding thresholds are supplied by NOAA’s Office for Coastal Management.
No region currently selected. Please choose a region from the drop-down menu or select a station pin in the map.
National
NOAA has been issuing Annual High Tide Flooding Outlooks and Assessments for over 10 years. This year, 13 more stations now have high tide flooding predictions for the coming year and decadal projections out to the year 2050.
2025-2026 Outlook
Frequencies of high tide flooding continue to increase across the country.
- Over the next meteorological year, May 2025 to April 2026, the U.S. is predicted to experience a median of 4 to 9 high tide flood days.
- El Niño Southern Oscillation (ENSO) conditions are neutral, meaning global oceanic and atmospheric patterns are closer to their long-term baselines, reducing the influence of ENSO on seasonal weather patterns and high tide flooding in many areas of the country.
- The Pacific Islands are predicted to experience the greatest number of flood days this year, 8 to 20 days. The Western Gulf is next with 6 to 15 predicted high tide flood days.
- NOAA predicts an above-normal 2025 Atlantic Hurricane Season, which could increase flooding for coastal communities along Gulf, Caribbean, and Atlantic coasts.
- NOAA predicts a near-normal 2025 Pacific Hurricane Season, which could reduce flooding related to tropical cyclones, tropical depressions, tropical storms and hurricanes. Though the Pacific season is predicted to be less active, weather-driven events combined with global sea level change continue to drive flooding in the region.
- Overall, the U.S. is predicted to experience a median of 5 more flood days per year compared to the year 2000, a more than 200% increase.
- As sea levels continue to change, coastal communities will experience more frequent high tide flooding, a national average of 55 to 85 days per year by 2050.
2024-2025 Review
Over the previous meteorological year, May 2024 to April 2025, the U.S. observed an average of 8 high tide flood days, within the predicted range of 4 to 8 days.
- More than 60% of stations experienced flooding within the predicted range, most notably in the Northeast, Mid-Atlantic, and continental Pacific regions.
- Stations in the Western Gulf and Hawaii experienced more flooding than predicted partially due to a combination of ongoing sea level change and above average sea surface temperatures that increased the potential for flooding.
- Pacific Island regions experienced the greatest number of flood days in the country with an observed median of 29 days. The Western Gulf was next with a median of nearly 17 flood days.
- 9 stations across the country met or exceeded previous high tide flooding records, partly due to weather-related events on top of high tide flooding. Examples of this include combined coastal flooding in the Mid-Atlantic due heavy rainfall related to Hurricane Helene, or the Category-5 Hurricane Beryl that impacted the Western Gulf.
National Flood Drivers
- While NOAA predicted La Niña conditions to persist into 2025, a transition to ENSO-neutral conditions occurred by mid 2024. This shift caused global oceanic and atmospheric patterns to move closer to their long-term baselines, reducing the influence on seasonal weather patterns and high tide flooding.
- Though ENSO-neutral conditions often suppress flooding in some parts of the country, increases in high tide flooding remain driven by three ongoing factors: global sea level change, land subsidence, and region-specific influences like above-average sea surface temperatures.
- These factors contribute to the potential for more severe storms, and more frequent instances of moderate and major levels of high tide flooding that can disrupt business, threaten homes, and damage infrastructure.
- Weather-driven events add to the impacts of high tide flooding. The 2024 Atlantic Hurricane Season named 18 storms and the 2024 Pacific Hurricane Season named 12 storms.
Note: Flood counts provided here are based on the exceedance of specific thresholds. Some of these flood counts are the result of compound flooding from waves, weather-driven events, and river discharge that add to the routine impacts of high tide flooding. Examples of compound flooding noted in this summary are correlated to each station's observed water levels through retrospective analysis.
Northeast
2025-2026 Outlook
This year, the Northeast is predicted to experience 6 to 12 high tide flood days.
- NOAA predicts an above-normal 2025 Atlantic Hurricane Season which could increase flooding for coastal communities over the coming year.
- Boston, MA, is predicted to experience the greatest number of high tide flood days, 12 to 19.
- Fall River, MA, and New Haven, CT, stations now have high tide flooding predictions for the coming year and decadal projections out to 2050.
- Though the frequency of high tide flooding varies from year to year, the Northeast experiences a median of 6 more high tide flood days per year compared to the year 2000, an over 150% increase.
2024-2025 Review
The Northeast experienced a median of 8 flood days during the 2024-25 meteorological year, within the predicted range of 7 to 12 days.
- Bar Harbor, ME, observed the greatest amount of high tide flooding in the region, 13 days, within the predicted range of 10 to 17 days.
- The Northeast is not heavily influenced by fluctuations in theEl Niño Southern Oscillation (ENSO). Persistent high tide flooding in the Northeast is largely driven by sea level change.
- No stations met or exceeded previous high tide flooding records.
Regional Flood Characteristics
The Northeast continues to experience rapid increases in high tide flooding due to the long-term effects of sea level change.
- The Northeast is routinely impacted by high tide flooding primarily due to large tidal ranges and coastal storms, often occurring during the winter and spring seasons
- Offshore storms typically bring strong winds from the east and northeast, piling up water over the wide, shallow continental shelf.
Mid-Atlantic
2025-2026 Outlook
This year, the Mid-Atlantic is predicted to experience 8 to 13 high tide flood days.
- NOAA predicts an above-normal 2025 Atlantic Hurricane Season which could increase flooding for coastal communities over the coming year.
- Windmill Point, VA, is again predicted to experience the greatest number of high tide flood days in the region, 13 to 21 days.
- The following stations now have high tide flooding predictions for the coming year and decadal projections out to 2050: Delaware City, DE; Ocean City Inlet, MD; Chesapeake City, MD; Yorktown USCG Training Center, VA; and Money Point, VA.
- Though the frequency of high tide flooding varies year to year, the Mid-Atlantic experiences an average of 8 more high tide flood days per year compared to the year 2000, an almost 250% increase.
2024-2025 Review
The Mid-Atlantic experienced a median of 12 flood days over the 2024-25 meteorological year, within the predicted range of 7 to 12 days.
- Solomons Island, MD, observed 16 flood days, tying its 2023 record. Many of these flood days can be attributed to heavy rainfall in the fall of 2024, and an active Atlantic hurricane season that added to the impacts of routine high tide flooding.
- Lewisetta, VA, and Windmill Point, VA, also experienced 16 flood days, above the predicted amount for Lewisetta. Increased flood counts could be partially attributed to regional influences, like the above-average 2024 Atlantic Hurricane Season.
- The Mid-Atlantic is sensitive to fluctuations in the El Niño Southern Oscillation (ENSO). The return of ENSO-Neutral conditions in mid 2024 shifted global oceanic and atmospheric patterns closer to their long-term baselines, reducing the influence of ENSO on seasonal weather patterns and high tide flooding.
Regional Flood Characteristics
The Mid-Atlantic continues to experience rapid increases in high tide flooding due to the long-term effects of sea level change.
- The region experiences routine high tide flooding throughout the year due to its low-lying coastal lands, and a wide, shallow continental shelf, which is often exposed to storms.
- Coastal flooding in this region is predominantly weather driven, including both tropical systems coming up the coast from the south, and non-tropical offshore storms bringing winds and ocean currents from the east and northeast.
Southeast
2025-2026 Outlook
This year, the Southeast is predicted to experience 6 to 9 high tide flood days.
- NOAA predicts an above-normal 2025 Atlantic Hurricane Season which could increase flooding for coastal communities over the coming year.
- Trident Pier, FL, is predicted to experience the greatest number of high tide flood days, 16 to 22.
- Wrightsville Beach, NC, now has high tide flooding predictions for the coming year and decadal projections out to 2050. This meteorological year, it is predicted to experience 12 to 21 flood days.
- Though the frequency of high tide flooding varies year to year, the Southeast now experiences an average of 6 more high tide flood days per year compared to the year 2000, a nearly 500% increase.
2024-2025 Review
The Southeast experienced a median of nearly 9 flood days over the 2024-2025 meteorological year, more than the predicted range of 4 to 7 days.
- Trident Pier, FL, experienced the greatest number of high tide flood days, 18. Duck, NC, experienced the next highest in the region, 14 days, above the regional median.
- Vaca Key, FL, observed 2 high tide flood days, breaking its 2022 record, slightly above the projected range of up to 1 day.
- The Southeast is sensitive to fluctuations in the El Niño Southern Oscillations (ENSO) in the Carolinas, but less so in Florida. The return of ENSO-Neutral conditions in mid 2024 caused global oceanic and atmospheric patterns to shift closer to their long-term baselines, reducing ENSO-related influences to seasonal weather patterns and high tide flooding in susceptible regions.
- Increased flood counts could be attributed to regional influences like the above-average 2024 Atlantic Hurricane Season.
Regional Flood Characteristics
The Southeast Coast continues to experience increases in high tide flooding due to the long-term effects of sea level change.
- Recent, rapid changes in relative sea level are caused by global sea level change, regional oceanographic effects, and, in some low-lying areas, land subsidence,
- This region of the U.S. is largely composed of low-lying areas prone to minor flooding. These low-lying areas, coupled with land subsidence and global sea level change, have observed more frequent high tide flooding events over the past few decades.
- A narrow continental shelf limits storm surge formation during extreme weather events. Flooding in this region is largely driven by Atlantic hurricanes and extratropical cyclones that add to high tide flooding impacts along the East Coast.
East Gulf Coast
2025-2026 Outlook
This year, the Eastern Gulf is predicted to experience a median of 3 to 7 flood days.
- NOAA predicts an above-normal 2025 Atlantic Hurricane Season which could increase flooding for coastal communities over the coming year.
- The Eastern Gulf isn’t as sensitive to fluctuations in the El Niño Southern Oscillation (ENSO) as other regions, and is less likely to experience ENSO-related changes in predicted high tide flooding.
- Overall, the Eastern Gulf experiences a median of 4 more high tide flood days per year compared to the year 2000, a more than 250% increase.
- This year, Naples, FL, now has high tide flooding predictions for the coming year and decadal projections out to 2050.
2024-2025 Review
The Eastern Gulf experienced a median of 7 flood days, the high end of the predicted range of 3 to 7 days.
- Bay Waveland, MS, observed the greatest amount of high tide flooding, 14 days, within the predicted range of 10 to 17 days.
- 2 stations tied their previous high tide flooding records set in 2023: Ft. Meyers, FL, observed 7 flood days, and St. Petersburg, FL, observed 6 days.
- The return of ENSO-Neutral conditions in mid 2024 caused global oceanic and atmospheric patterns to shift closer to their long-term baselines, reducing the influence of ENSO on seasonal weather patterns and high tide flooding.
Regional Flood Characteristics
This region of the country is routinely impacted by severe weather that often contributes to flood events, with extreme flooding usually caused by Atlantic hurricanes.
- Due to these severe weather impacts, coupled with land subsidence and sea level change, high tide flooding in the region is becoming even more frequent and impactful.
- Predictions for the region vary year to year due to large-scale weather and ocean current patterns.
West Gulf Coast
2025-2026 Outlook
The Western Gulf is predicted to experience a median of 6 to 15 flood days.
- Stations in Galveston Bay, TX, are predicted to experience some of the greatest numbers of high tide flood days in the region: Galveston Pier 21, TX, is predicted to observe 13 to 20 days, and Eagle Point, TX, is predicted to experience the most, 38 to 60 days. Note: Observed flood counts at Eagle Point can be influenced by oceanic and atmospheric variables, like fresh water runoff, not monitored by NOAA water level stations.
- NOAA predicts an above-normal 2025 Atlantic Hurricane Season which could increase flooding for coastal communities over the coming Outlook season.
- The Western Gulf is heavily influenced by fluctuations in the El Niño Southern Oscillation (ENSO) conditions. The return of ENSO-Neutral conditions means global oceanic and atmospheric patterns are closer to their long-term baselines, reducing the influence on seasonal weather patterns and high tide flooding.
- Though high tide flooding varies greatly from year to year, the Western Gulf now experiences an average of 10 more high tide flood days per year compared to the year 2000, a more than 400% increase.
- Port Fourchon, Belle Pass, LA, and Calcasieu Pass, LA, now have high tide flooding predictions for the coming year and decadal projections out to 2050.
2024-2025 Review
The Western Gulf experienced a median of 17 flood days, above the predicted 7 to 15 days.
- Every station in the Western Gulf experienced more flooding than predicted, possibly due to above-average sea surface temperatures and the above-average 2024 Atlantic Hurricane Season that contributed to observed flooding across the region.
- 3 Texas stations set new records in 2024: Morgans Point with 24 days, Rockport with 18 days, and Port Isabel with 7 flood days.
- Changes in the number of observed flood days compared to previous years can be attributed to the transition from La Niña to ENSO-Neutral conditions, which limited the effects of persistent high tide flooding.
Regional Flood Characteristics
- The Western Gulf is frequently impacted by high tide flooding from the combined effects of land subsidence and ongoing sea level change. These factors contribute to extreme coastal flooding during hurricanes.
- Note: Flood counts represent the number of days where observed water levels exceed the NOAA NOS minor flood threshold. Actual impacts can vary in this region depending on local geography, infrastructure, and mitigation efforts.
Southwest
2025-2026 Outlook
The Southwest Pacific coast is predicted to experience up to 3 high tide flood days this year.
- North Spit, Humboldt Bay, CA, and San Diego, CA, are predicted to experience the greatest number of flood days, 7 to 13 days and 4 to 9 days, respectively.
- El Niño Southern Oscillation (ENSO) conditions are neutral and predicted to remain so through the 2025-26 meteorological year, reducing the potential for ENSO-related impacts on routine high tide flooding.
- Though high tide flooding varies greatly each year, the Southwest overall experiences an average of 1 more high tide flood day per year compared to the year 2000, a nearly 150% increase.
- Crescent City, CA, now has high tide flooding predictions for the coming year and decadal projections out to 2050.
2024-2025 Review
As a region, the Southwest Coast experienced a median of 1 flood day, within the predicted range of 1 to 3 days.
- North Spit, Humboldt Bay, CA, continues to experience the greatest amount of high tide flooding, 7 days, above the regional median, but within the station’s predicted range of 7 to 13.
- The return of ENSO-Neutral conditions means global oceanic and atmospheric patterns are closer to their long-term baselines, reducing the influence of ENSO on seasonal weather patterns and high tide flooding.
- No stations experienced a record number of flood days over the previous meteorological year. Flooding in the region was largely caused by weather-driven events.
Regional Flood Characteristics
Recent changes in relative sea levels are caused by global sea level change and regional oceanographic effects.
- In general, a narrow continental shelf and relatively infrequent coastal storm systems limit the frequency of significant flood events although this region can experience damaging flood levels from high waves.
- Flooding in this region is heavily influenced by the El Niño Southern Oscillation (ENSO). The return of ENSO-Neutral conditions should limit ENSO-related increases to high tide flooding.
Northwest
2025-2026 Outlook
The Pacific Northwest is predicted to experience up to 8 high tide flood days this year.
- Toke Point, WA, is predicted to experience the greatest number of flood days, 4 to 16 days. South Beach, OR, is expected to experience 1 to 10 days, while Port Orford, OR, Charleston, OR, and Friday Harbor, WA, are predicted to experience up to 8 high tide flood days; the high end of the regional range.
- El Niño Southern Oscillation (ENSO) conditions are neutral and predicted to remain so through the 2025-26 meteorological year, reducing the potential for ENSO-related impacts to routine high tide flooding.
- High tide flooding in the Northwest remains relatively consistent to observed values in the year 2000.
- Astoria, OR, and Neah Bay, WA, now have high tide flooding predictions for the coming year and decadal projections out to 2050.
2024-2025 Review
The Northwest Coast experienced a median of 6 flood days, within the predicted range of up to 7 days.
- Toke Point, WA, continues to experience the greatest amount of high tide flooding in the region at 14 days, within the predicted range of 3 to 16 days
- This region is heavily influenced by fluctuations in the El Niño–Southern Oscillation (ENSO). The 2023-24 El Niño event brought warmer water to the coast early in the year could have contributed to observed flooding in the region.
- No stations met or exceeded previous high tiding food records during the last outlook season. Flooding in the region was largely caused by weather-driven events.
Regional Flood Characteristics
Recent rises in relative sea levels are caused by vertical land movement, global sea level rise, and regional oceanographic effects.
- Year to year variations in high tide flood frequencies in this region are highly associated with El Niño conditions.
- Flooding in the Pacific Northwest is less tidally driven and more often the result of extreme weather events and ocean currents.
- Heavy winds create large waves that contribute to flooding the region. While these waves are not yet fully captured in NOAA's water level observations, they can overtop coastal structures.
- The continental shelf in the northern Pacific is deeper and narrower than the southern Pacific, leaving it more exposed to winter storms that can amplify storm surge and flood low-lying areas.
Pacific Islands
2025-2026 Outlook
The Western Pacific Islands are predicted to experience 8 to 20 high tide flood days this year.
- Wake Island is predicted to experience some of the greatest number of flood days, 4 to 20. Apra Harbor, Guam, is predicted to experience the next highest number of flood days, 4 to 18.
- El Niño Southern Oscillation (ENSO) conditions are neutral and predicted to remain so through the 2025-26 meteorological year, reducing the potential for ENSO-related impacts to routine high tide flooding.
- Though high tide flooding varies greatly each year, the Pacific Islands overall experience an average of 11 more high tide flood days per year compared to the year 2000, a nearly 350% increase.
2024-2025 Review
The Western Pacific Islands experienced a median of 29 flood days, more than the predicted range of 5 to 16 days.
- Wake Island observed some of the greatest number of high tide flood days in the region, 37 days. Kwajalein Island, as in previous years, experienced the greatest number, 66 days.
- Changes in the number of observed flood days compared to previous years can be attributed to the transition from La Niña to ENSO-Neutral conditions, limiting effects on persistent high tide flooding.
- Wake Island and Apra Harbour, Guam observed more flooding than predicted. Midway Island and Pago Pago, American Samoa experienced flooding on the low end of their predicted ranges. Kwajelien Island experienced less flooding than predicted.
- Most stations in the region observed high tide flooding within the predicted range.
Regional Flood Characteristics
The Pacific Islands continue to experience rapid increases in high tide flooding.
- Recent changes in relative sea levels can be attributed to land subsidence, global sea level change, and regional oceanographic effects.
- NOAA ranks 2024 as the warmest year in its global temperature record. Warmer water contributes to higher sea levels, leading to very high tides, like king tides, that inundate a larger extent and create greater impacts.
Note: Pacific Island flood thresholds were adjusted on June 1, 2023 to better match on-the-ground reports of flooding. This change impacts the Annual Outlooks for the Pacific Islands compared to previous years. Adjusted flood thresholds may not be representative of flooding around Kwajalein Island. Reported flood days represent the number of observed and predicted days where water levels exceed the flood threshold. The number of true flood days may be lower.
Pacific Islands
2025-2026 Outlook
The Eastern Pacific Islands are predicted to experience 8 to 20 high tide flood days this year.
- Kawaihae, HI, is predicted to experience 21 to 40 high tide flood days, some of the greatest numbers in the region. Hilo, HI, is predicted to experience the next greatest with a range of 16 to 31, followed by Mokuoloe, HI, with 9 to 21 days.
- High tide flooding in the Hawaiian Islands isn’t heavily influenced by fluctuations in the El Niño Southern Oscillation (ENSO), limiting overall ENSO-related effects in the region.
- Though high tide flooding varies greatly each year, overall, the Eastern Pacific Islands experience an average of 11 more high tide flood days per year compared to the year 2000, a nearly 350% increase.
2024-2025 Review
The Eastern Pacific Islands experienced a median of 29 flood days, more than the predicted range of 5 to 16 days.
- All water level stations in Hawaii observed more flooding than predicted.
- Kawaihae, HI, and Hilo, HI, both experienced 46 high tide flood days, the greatest number in the region.
- 2 stations met or exceeded previous high tide flooding records over the last Outlook season: Nawiliwili, HI, tied its 2023 record with 29 days, and Kahului, HI, set a new station record with 36 days.
Regional Flood Characteristics
The Pacific Islands continue to experience rapid increases in high tide flooding.
- Recent changes in relative sea levels can be attributed to regional land subsidence, global sea level change, and regional oceanographic effects.
- NOAA ranks 2024 as the warmest year in its global temperature record.
- Warmer water contributes to higher sea levels, leading to very high tides, like king tides, that inundate a larger extent and create greater impacts.
Note: Pacific Island flood thresholds were adjusted on June 1, 2023 to better match on-the-ground reports of flooding. This change impacts the Annual Outlooks for the Pacific Islands compared to previous years. Reported flood days represent the number of observed and predicted days where water levels exceed the flood threshold. The number of true flood days may be lower.
Alaska
Regional Analysis
NOAA collects valuable oceanographic and meteorological information from water level stations across Alaska. Based on these long-term records, several factors make predicting high tide flooding in the region challenging.
- NOAA is still working to establish consistent and representative high tide flooding thresholds throughout Alaska.
- Many locations experience extreme tide ranges making it less likely a storm surge event will overlap with a high tide and create impacts.
- Coastal topography is steeper than other areas of the U.S., limiting areas that would be exposed to high tide flooding.
- Very few locations have tidal-to-geodetic elevation connections needed to empirically associate and map the extent and severity of inland flooding.
- Infrastructure is often placed in more protected areas away from the coast to limit exposure to extreme conditions in remote areas.
- Relative sea level is decreasing across much of Alaska due to glacial uplift, making tidally-driven coastal flooding less likely in the future.
Additional details and information can be found in Patterns and Projections of High Tide Flooding Along the U.S. Coastline Using a Common Impact Threshold. Near- and real-time flood conditions can be monitored through the Coastal Inundation Dashboard.
Caribbean Islands
Regional Analysis
NOAA collects valuable oceanographic and meteorological information from water level stations across the Caribbean. Based on these long-term records, the Caribbean does not show a long-term trend in high tide flood days.
- NOAA predicts an above-normal 2025 Atlantic Hurricane Season which could increase flooding for coastal communities over the coming year.
- El Niño Southern Oscillation (ENSO) conditions are neutral and predicted to remain so through the 2025-26 meteorological year, reducing the potential for ENSO-related water level changes.
2024-2025 Review
- Similar to previous years, the Caribbean region observed very little inundation related to high tide flooding. Observed flooding can be attributed to weather and storm related activity.
- La Niña conditions were predicted to persist into early 2025, but transitioned to ENSO-neutral conditions early on, limiting the amount of ENSO-related flooding impacts.
Regional Flood Characteristics
- Flooding in the Caribbean Islands is less tidally driven and more often the result of waves and weather events
- For this reason, minor flooding thresholds for the region are typically higher than average high tides.
- This does not preclude flooding that might occur at slightly lower heights, or flooding driven by extreme weather events, like hurricanes.
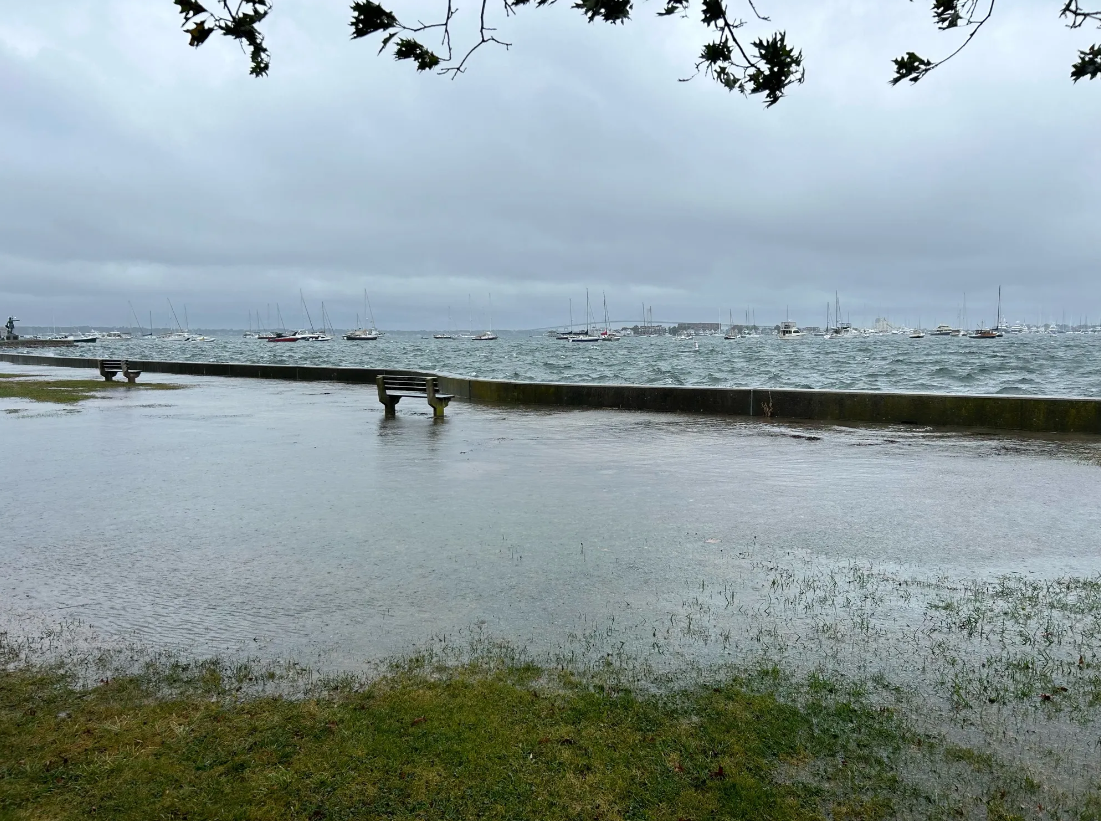
Flooding at high tide in Newport, Rhode Island.
Photo Credit: MyCoast.Org, Rhode Island, 10/20/24.
Location: Brenton Cove, King Park, Newport, Rhode Island
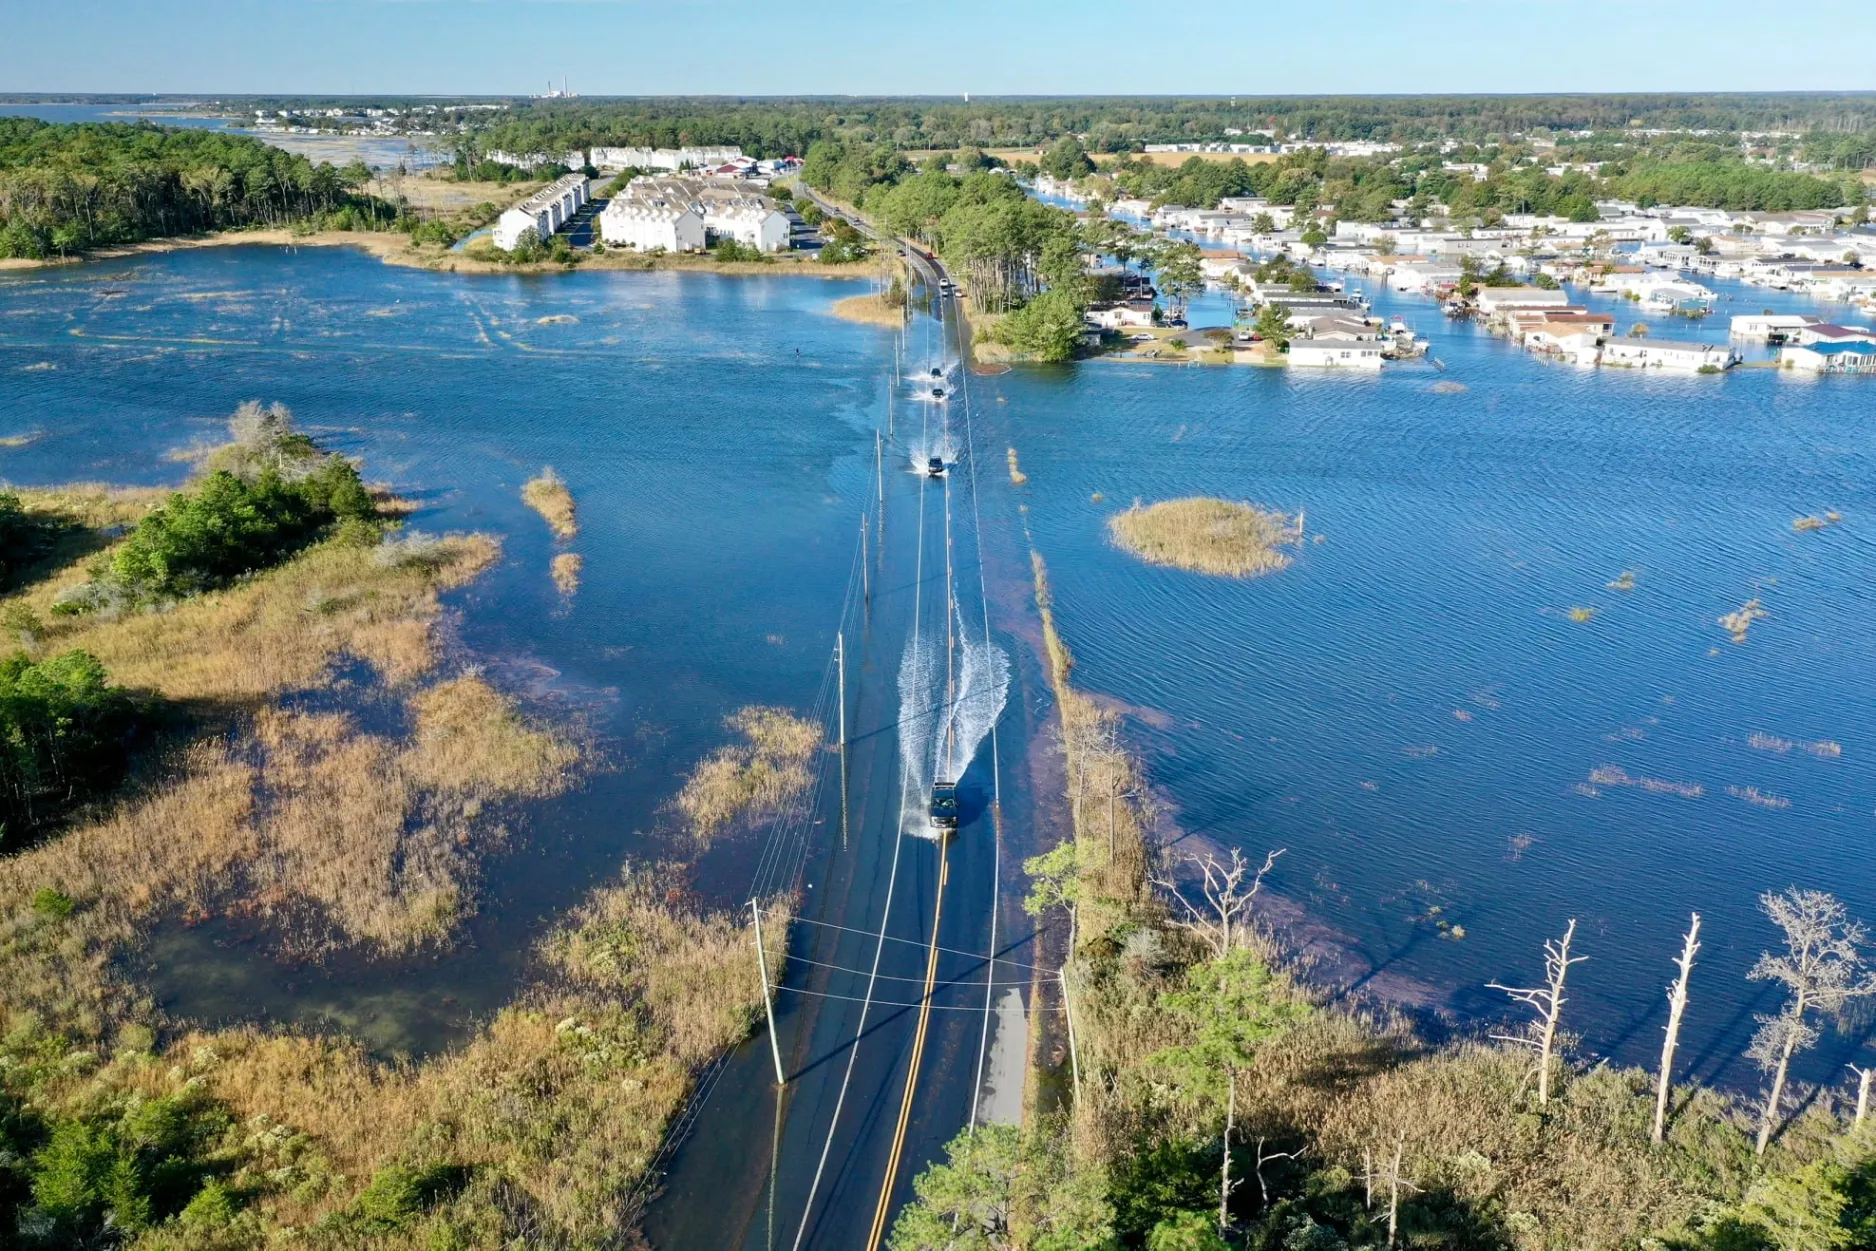
Cars driving along Long Neck Road between Rehoboth Bay & Indian River Bay encountered flooding due to simultaneous above normal high tide and new moon, which was exacerbated by multiple rounds of rain and onshore winds.
Photo Credit: Driscoll Drones, 2/25/2020.
Location: Long Neck Road, Millsboro, DE
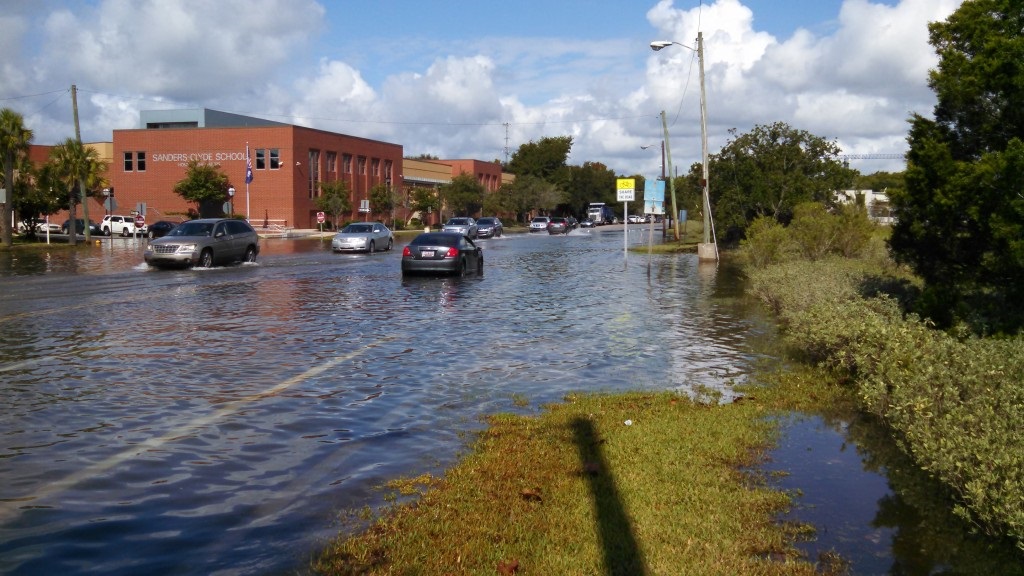
Cars travel through high water on E. Bay St in front of Sanders-Clyde Elementary School in Charleston, SC. The high tide flooding was due to a perigean spring tide.
Photo Credit: Sean Bath, 9/11/2014.
Location: Charleston, SC
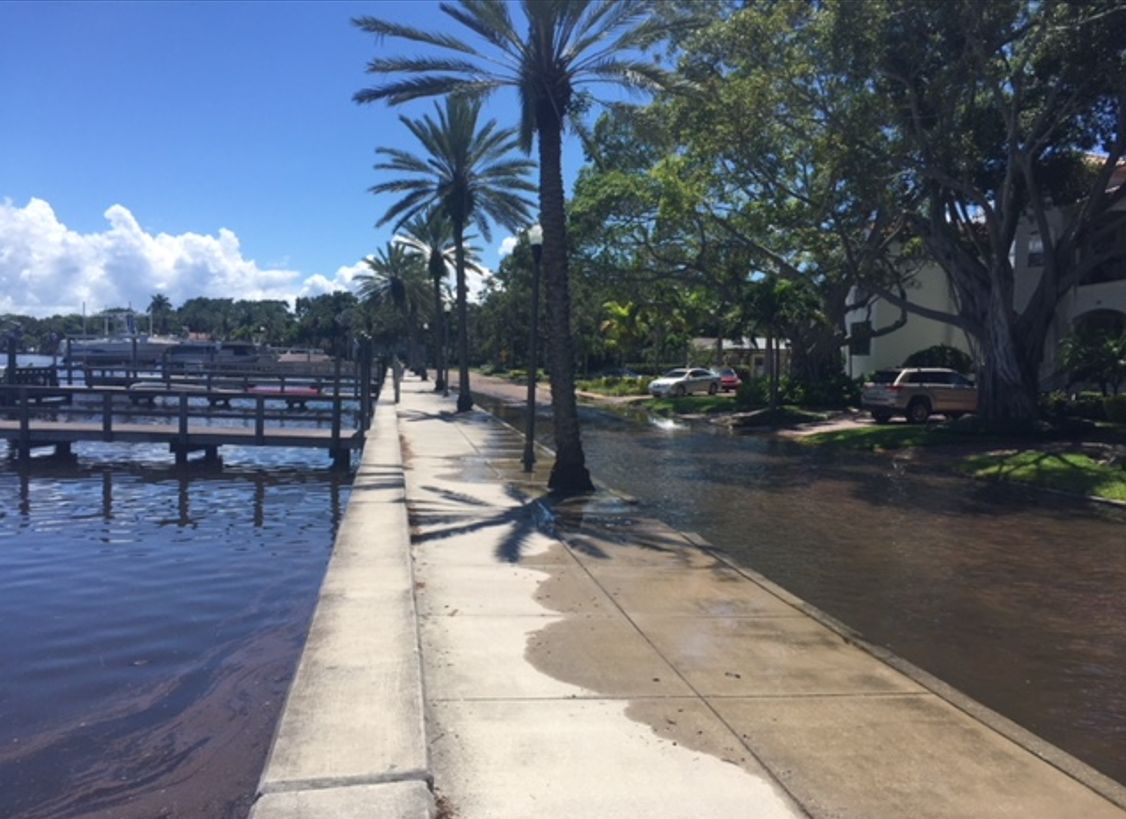
High tide flooding on a sunny day in St. Petersburg, Florida.
Photo Credit: Heidi Stiller, NOAA’s Office of Coast Management
Location: Coffee Pot Park, St. Petersburg, Florida. September, 2023
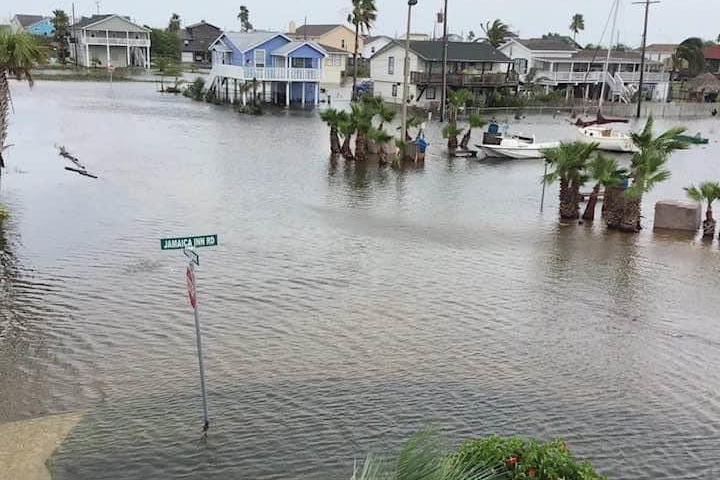
Persistently elevated water levels in West Bay cause high tide street flooding on Galveston Island around Jamaica Beach.
Photo Credit: Sheri Cortez, 6/25/2020.
Location: Jamaica Beach, TX
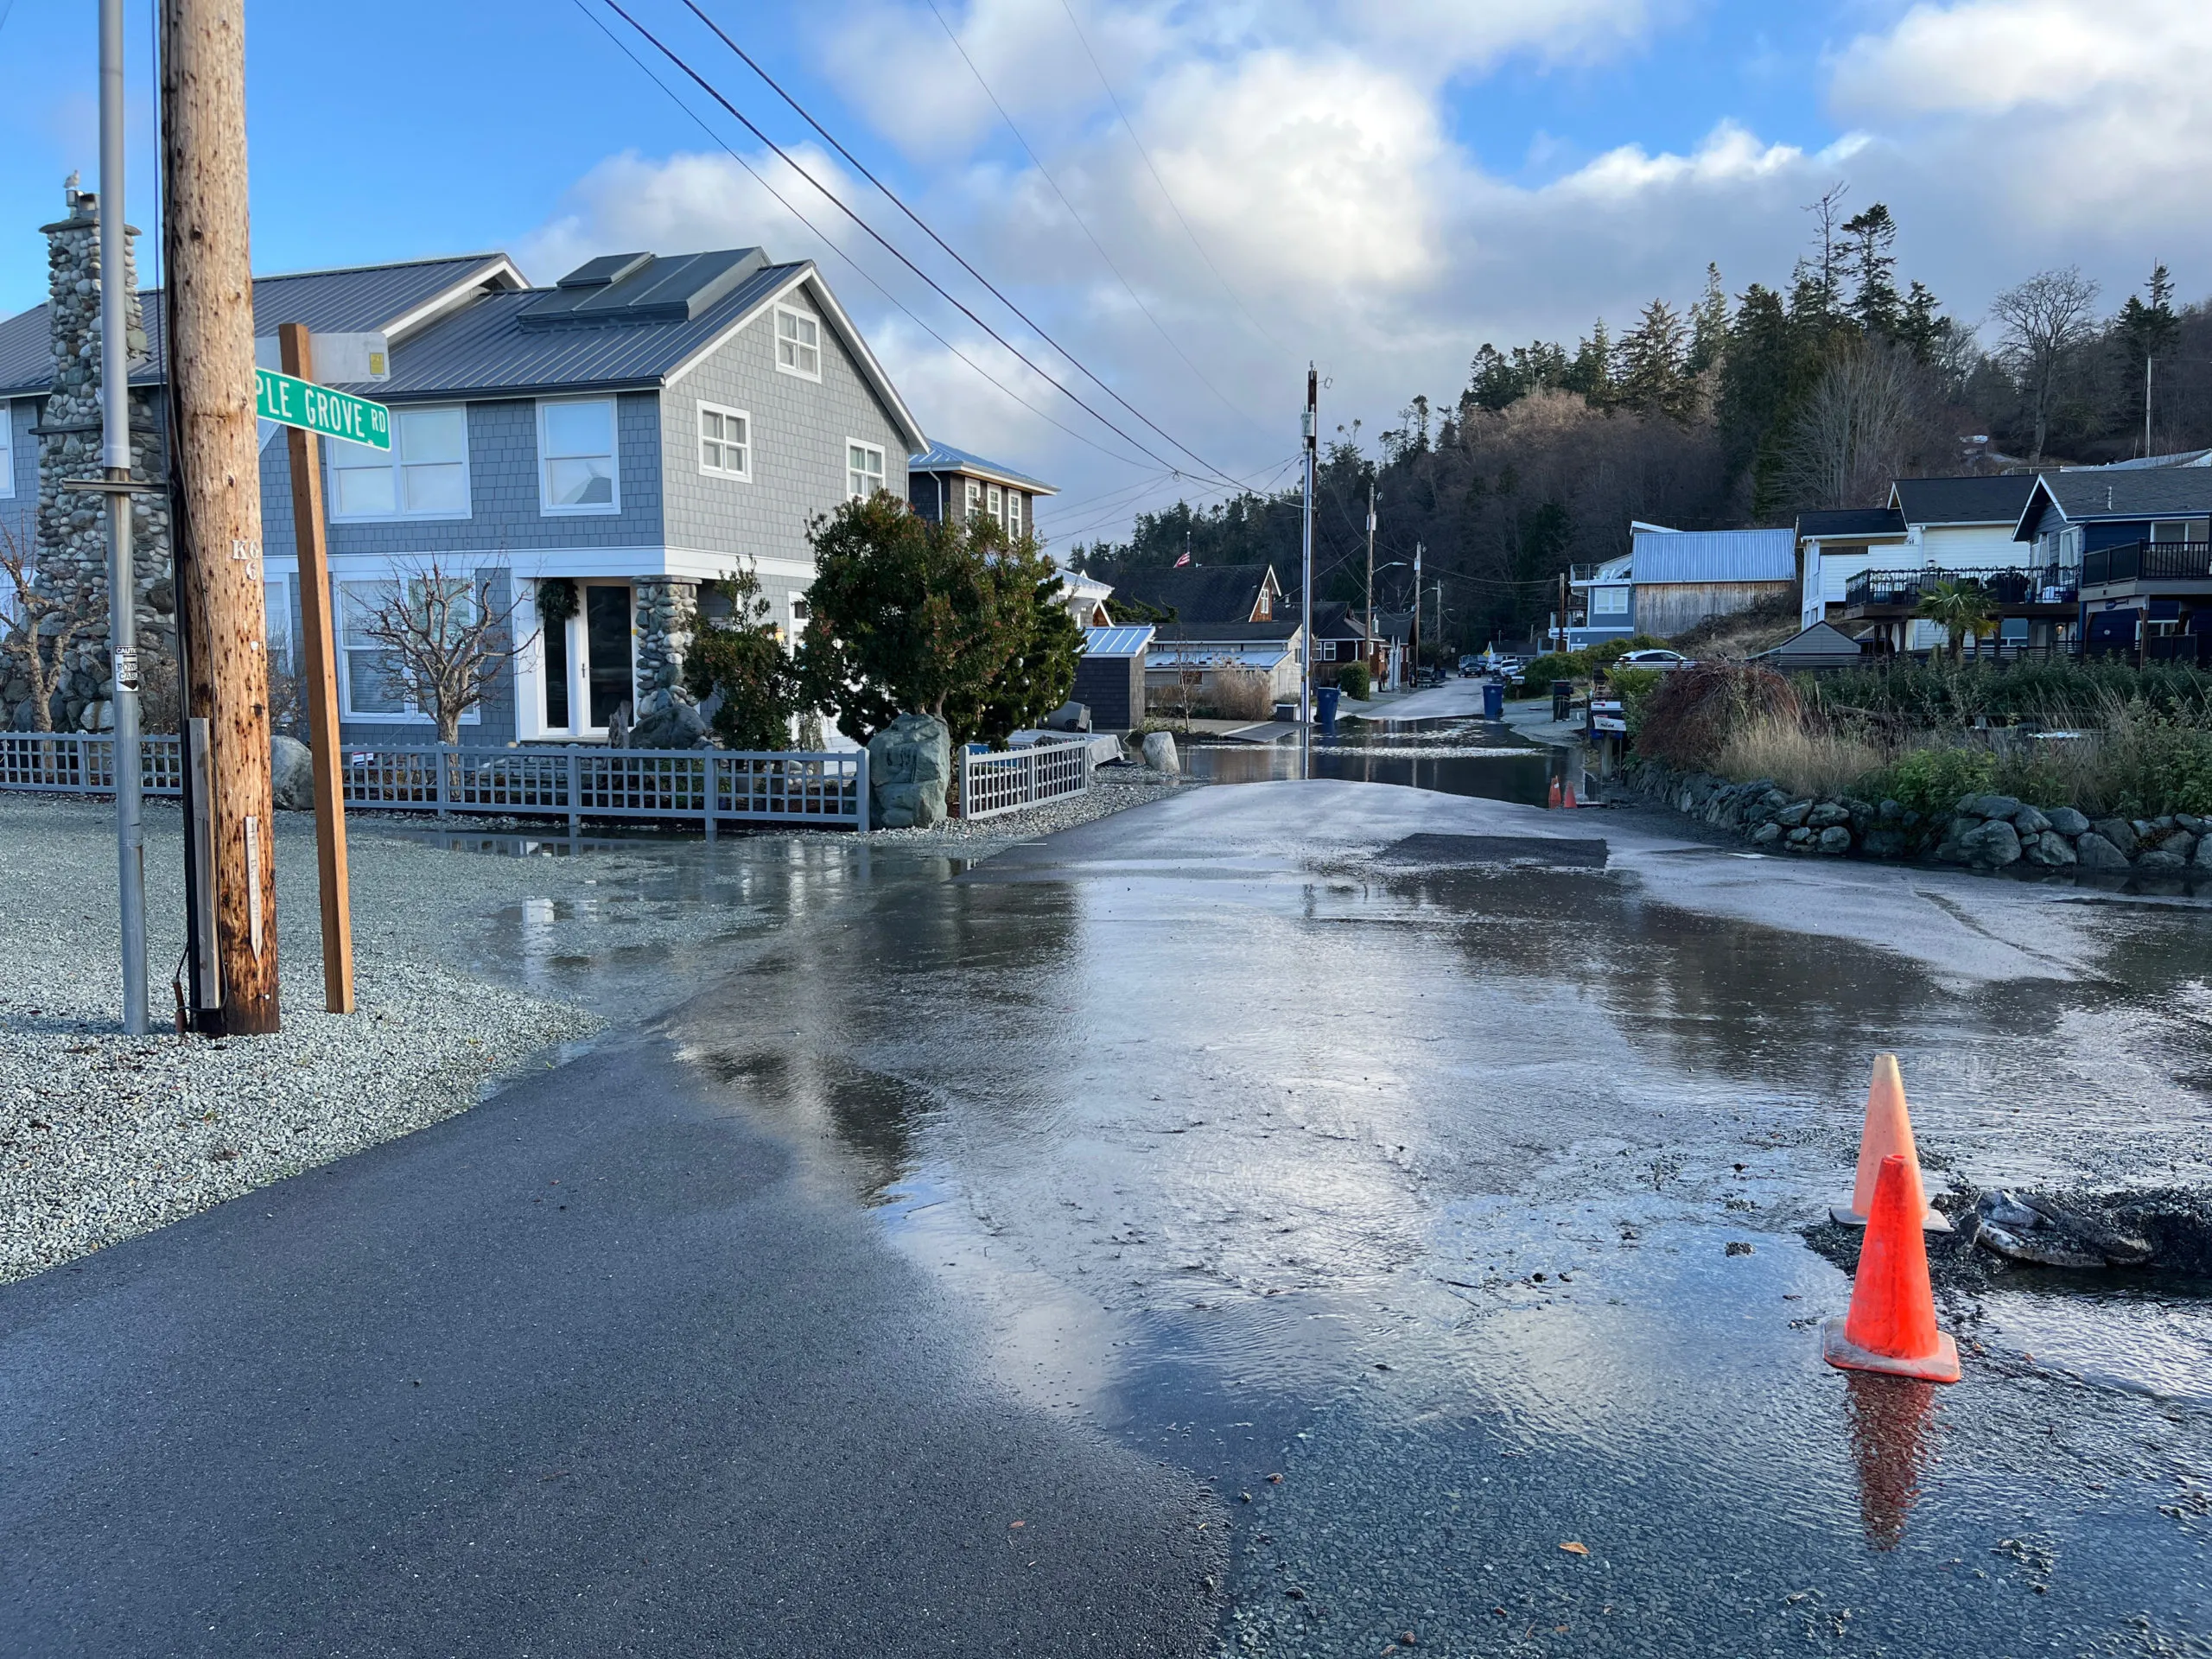
Minor high tide flooding blocks roadway on Camano Island.
Photo Credit: MyCoast, 12/30/2022
Location: Camano Island, Washington
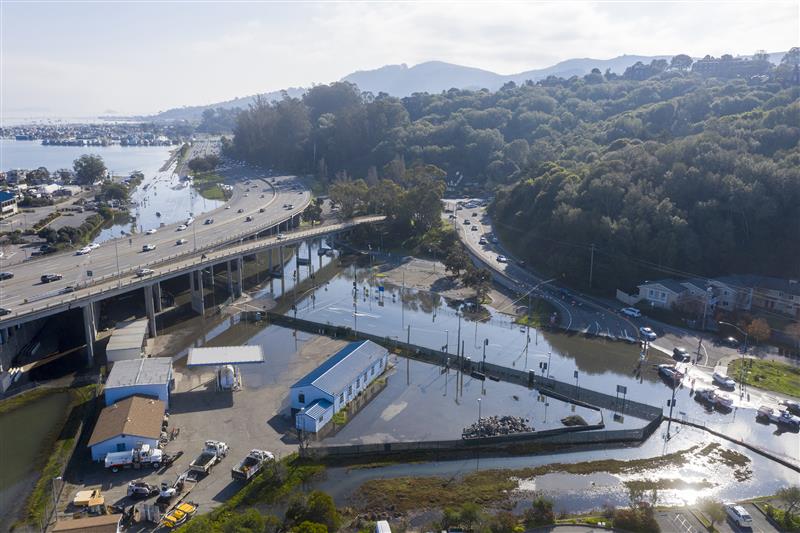
Aerial photo of the king tide at Manzanita Junction, Mill Valley. Water levels were higher than normal due to a perigean spring tide.
Photo Credit: California Coast Commission, 12/4/2021.
Location: Manzanita Junction, Mill Valley, CA
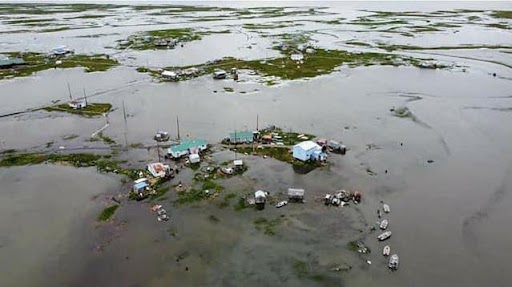
An aerial view of the flooding during an above normal high tide in Kwigillingok.
Photo Credit: Jesse Igkurak, 6/24/2021.
Location: Kwigillingok, Bering Sea Coast, AK
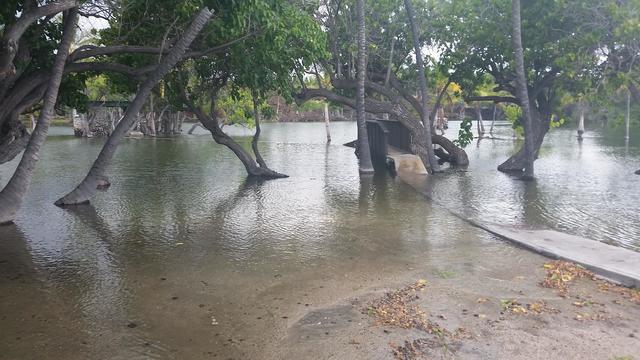
Water spilling over from Makaiwa Bay into Kalahuipua'a Fishponds during an above normal high tide on July 3, 2016.
Photo Credit: Chris Peters
Location: Kalahuipua'a fishponds, at Mauna Lani Hotel, Waimea, Hawaii
No Station Selected []
No Station Selected []
About the Annual Outlook
Above-normal tides can trigger high tide flooding, disrupting coastal communities. This flooding can occur on sunny days and in the absence of storms. More severe flooding may occur if high tides coincide with heavy rains, strong winds, or large waves. As sea levels continue to rise, our coastal communities will experience more frequent high tide flooding - a National average of 55 to 85 days per year by 2050. Predicting the frequency of high tide flooding in the future helps coastal communities plan for and mitigate flooding impacts.
The Annual High Tide Flooding Outlook provides the number of high tide flooding days predicted for the coming meteorological year (May to April). Data is supplemented with decadal projections for the year 2050, sea level rise scenarios, and high tide flood exposure maps to support long-term coastal planning. Summaries are provided for each region to account for geographical differences at the coast, and are accompanied by regional graphics to demonstrate potential high tide flooding impacts.
Using This Product
Begin by selecting a region and year from the drop down menu, or clicking a station on the map to see the number of observed and projected high tide flooding days. Click the region tab to learn more about regional drivers of higher water levels and potential high tide flooding impacts.
- Map View: Visualize high tide flooding observations and projections at NOS water level stations. Navigate the map by selecting a region from the drop-down menu or using the pan/zoom tools. Stations are color-coded to show flood frequencies for select meteorological years, the annual outlook year, and the projection for 2050.
- Region View: Learn why the annual outlook may be higher or lower than previous years for a selected region, and what coastal flooding impacts the region may experience as a result of its unique geographic characteristics.
- Station View: Interact with the current range of high tide flooding projection values and historical flood observations since 2000 to understand changes in flood frequency through time.
- Projection View: Interact with station-based decadal projections and sea level rise scenarios to understand and plan for future flooding impacts.
Underlying Science
The frequency of high tide flooding varies from year to year due to large-scale changes in weather and ocean circulation patterns, such as the phase of the El Niño Southern Oscillation (ENSO). The Annual Outlook uses a statistical model that derives a range of high tide flooding days predicted for each National Ocean Service (NOS) water level station over the coming meteorological year, May to April. The model combines historical flood observations (relative to established NOS flood thresholds) with the Oceanic Niño Index (ONI) and the 3- month average of sea-surface temperature anomalies. Decadal projections are based on a statistical fit of historical water level observations and the sea level rise scenarios outlined in the Sea Level Rise Technical Report. Each decade consists of an average of annual values calculated from data points from the previous ten years. Additional details about the methodology are detailed in Sweet, et al. 2018.
Related Resources
- High Tide Flooding Publications Archive: 2016-2023
- Guided Animation: High Tide Flooding
- NOS Ocean Fact: Perigean Spring Tides
- Video (1-minute) & NOS Ocean Fact: What is High Tide Flooding
- Another use for ENSO forecasts: predicting high-tide flooding in the U.S.
- Climate.gov tweet chat: Talk with a sea level rise expert about past and future risk of high-tide flooding on U.S. coasts