Monthly High Tide Flooding Outlook
This map shows the maximum daily likelihood of high tide flooding at National Water Level Observation Network stations for the selected month represented by color-coded pins. The National Ocean Service minor flooding threshold layer is supplied by NOAA’s Office for Coastal Management.
Last model run: ####-##-##
No region currently selected. For a regional summary of the reasons for high tide flooding and the general impacts, please choose a region from the drop-down menu or select a station pin in the map.
Northeast Outlook
Reasons
Mean sea level is generally higher in the late summer and the early fall months, in part due to warmer temperatures and changes in the weather patterns. Expect higher tides on and around the dates of the new moon (know as spring tides). Anew moon will occur on August 04, and full moon will occur on August 19(CT).
Coastal Impacts
in many locations of the Gulf Coast, the tidal range is relatively small compare to other reagions of the U.S so they will not be as significant impacted by a perigean spring tide
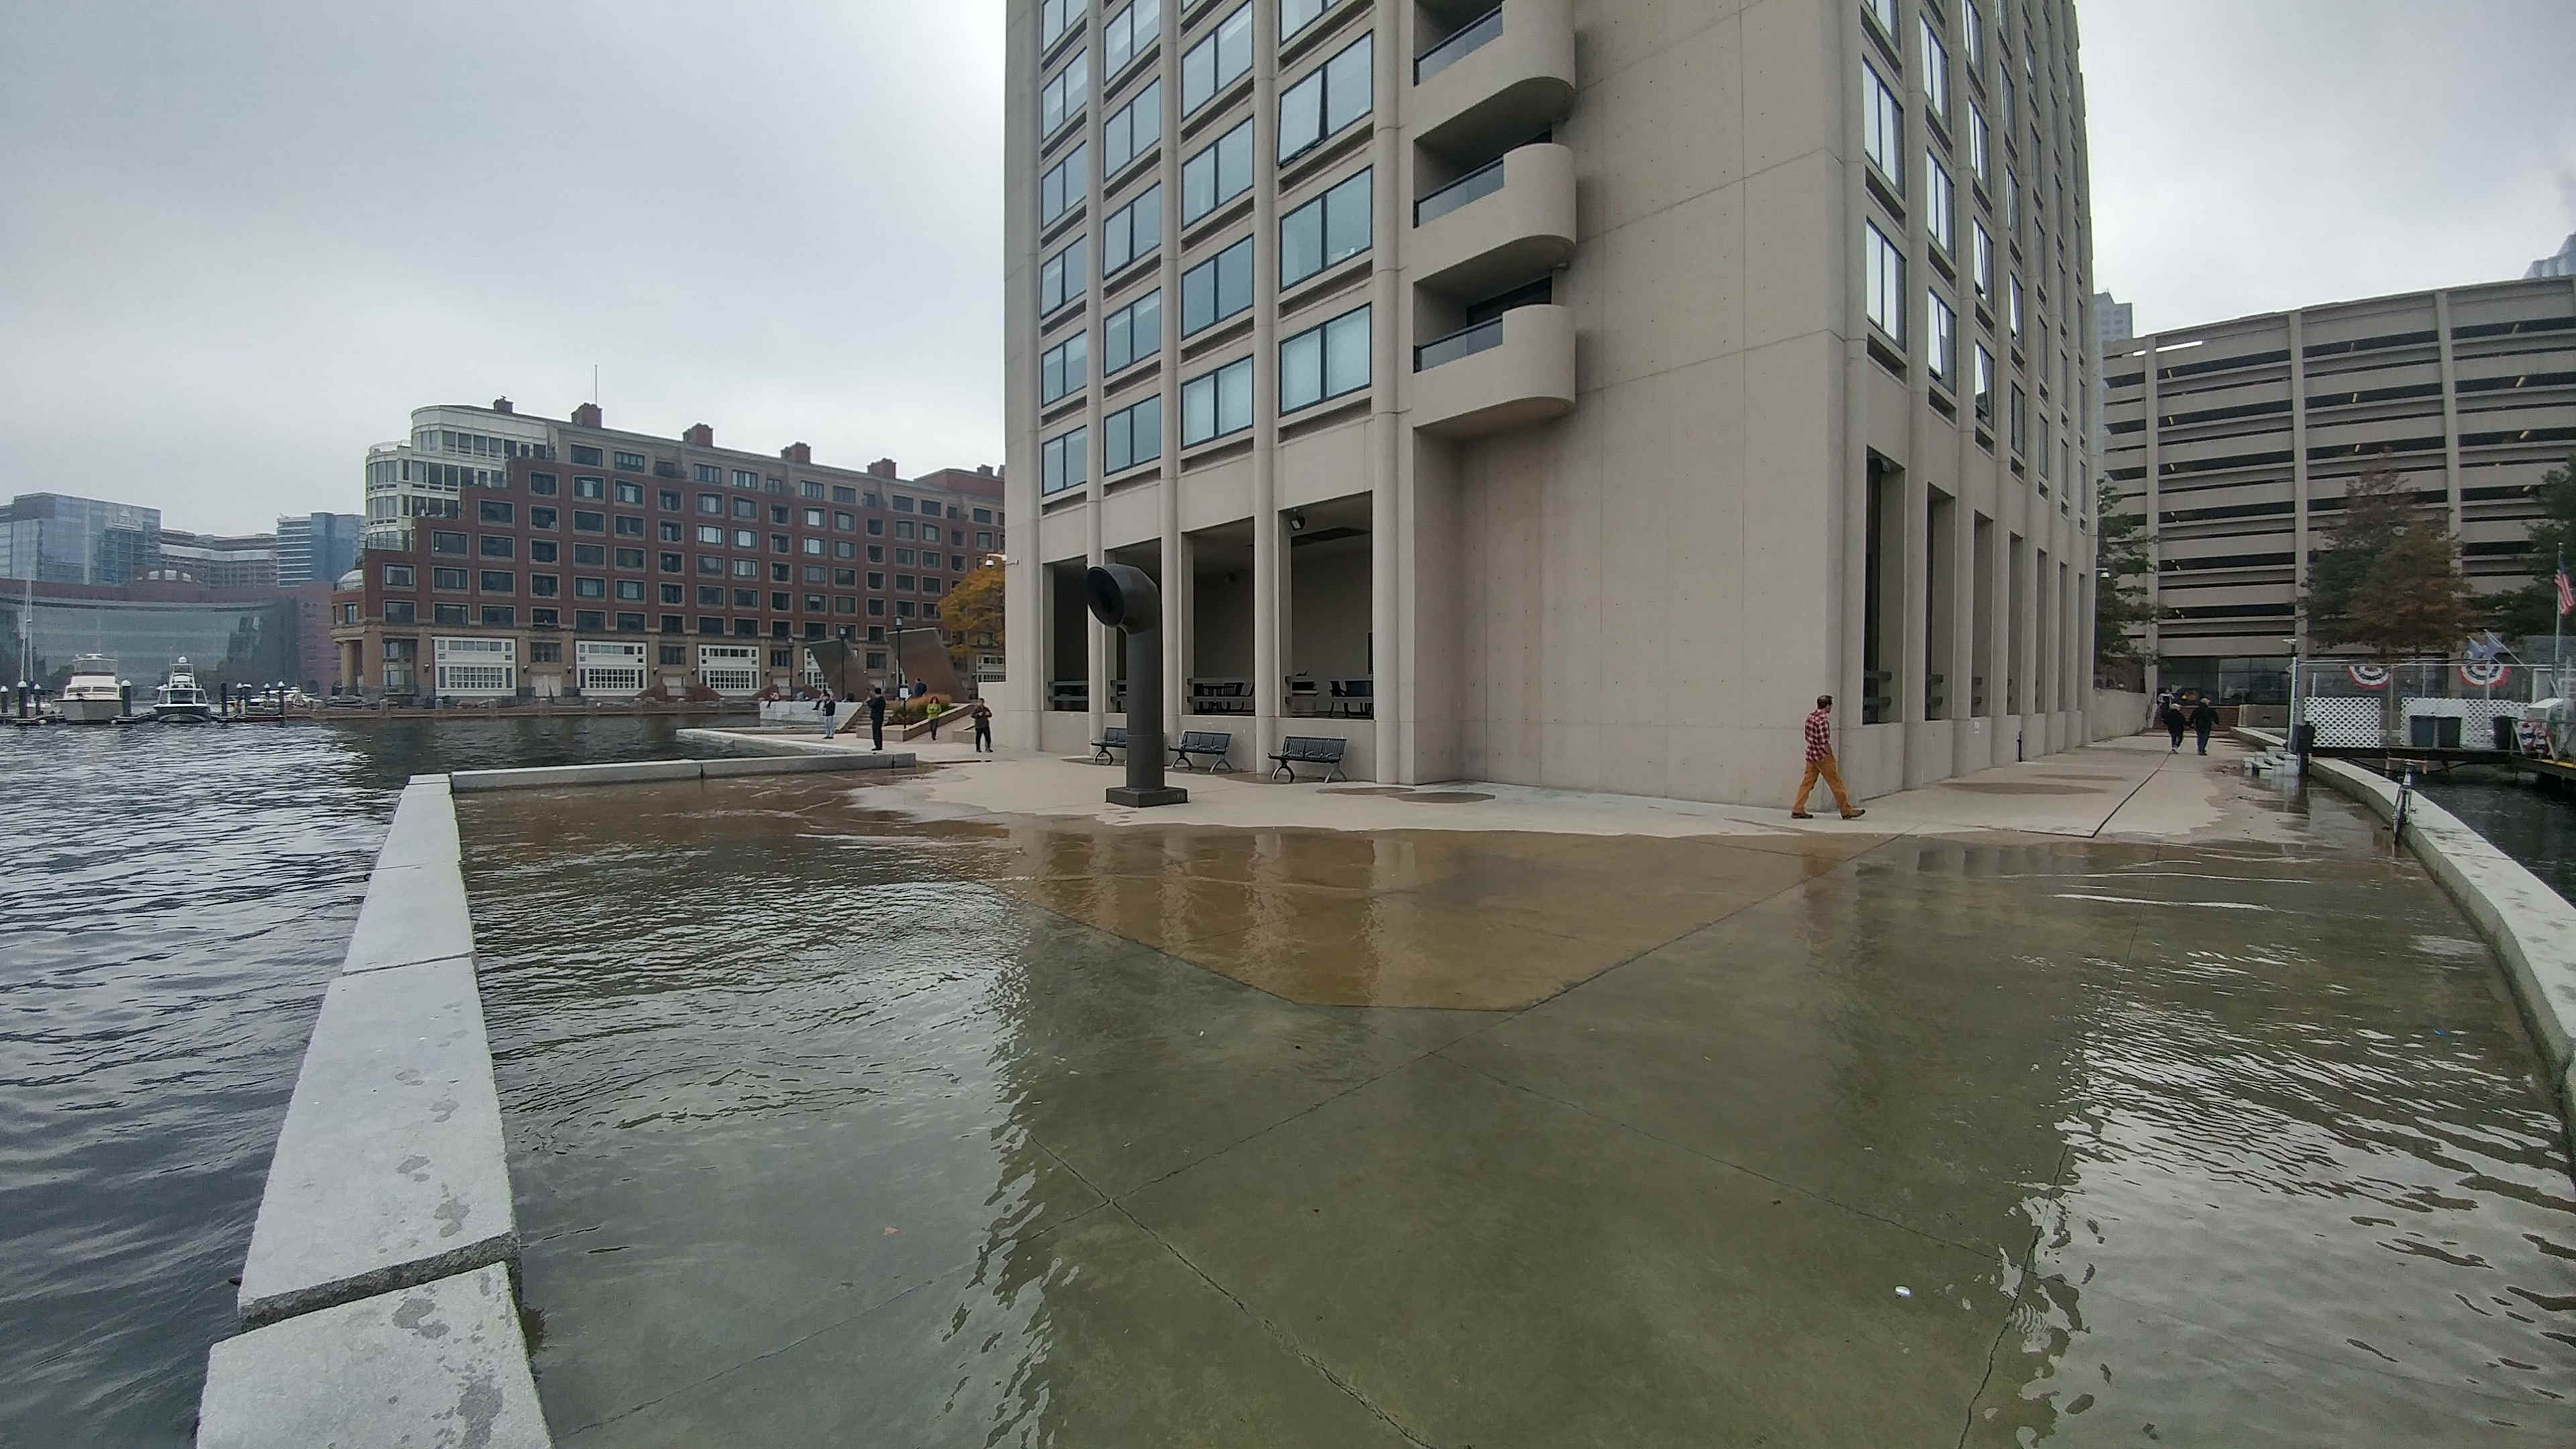
High tide flooding pushes water onto a walkway along the Boston waterfront near India Wharf.
Photo Credit: MyCoast.org, 10/18/2016.
Location: Near India Wharf, Boston, MA
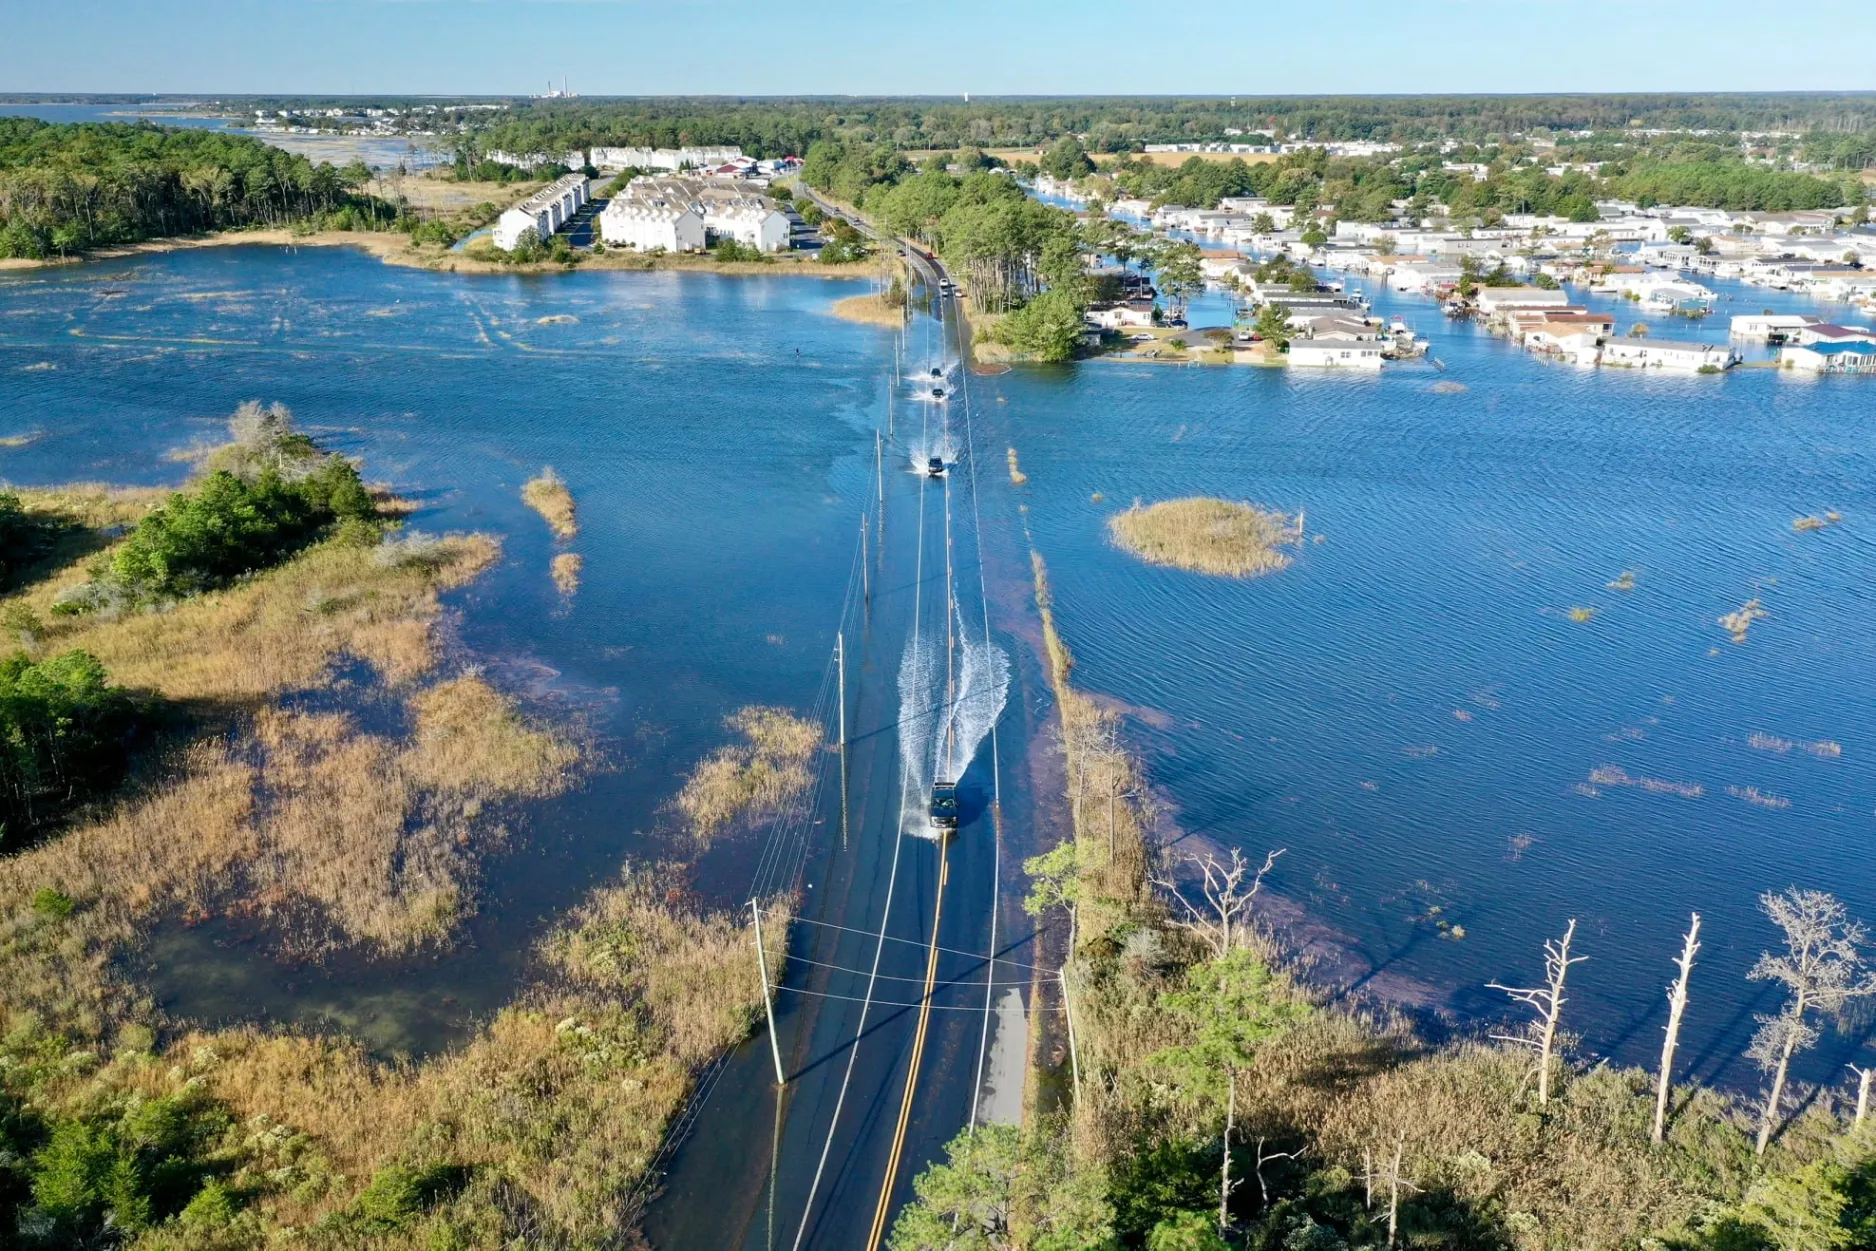
Cars driving along Long Neck Road between Rehoboth Bay & Indian River Bay encountered flooding due to simultaneous above normal high tide and new moon, which was exacerbated by multiple rounds of rain and onshore winds.
Photo Credit: Driscoll Drones, 2/25/2020.
Location: Long Neck Road, Millsboro, DE
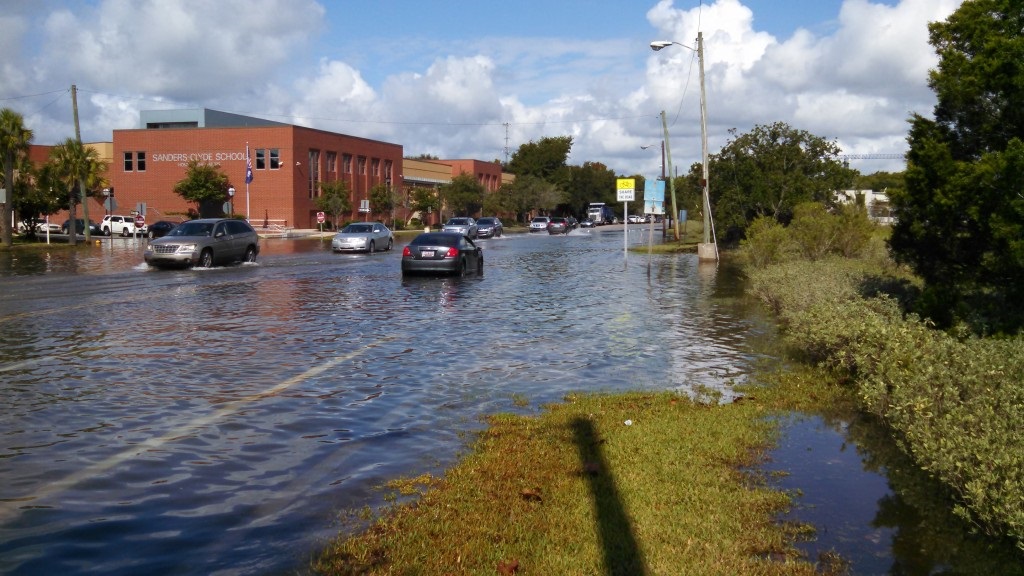
Cars travel through high water on E. Bay St in front of Sanders-Clyde Elementary School in Charleston, SC. The high tide flooding was due to a perigean spring tide.
Photo Credit: Sean Bath, 9/11/2014.
Location: Charleston, SC
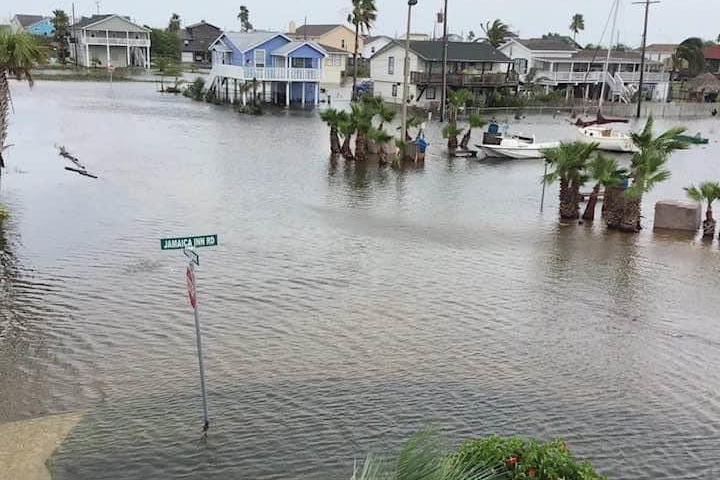
Persistently elevated water levels in West Bay cause high tide street flooding on Galveston Island around Jamaica Beach.
Photo Credit: Sheri Cortez, 6/25/2020.
Location: Jamaica Beach, TX
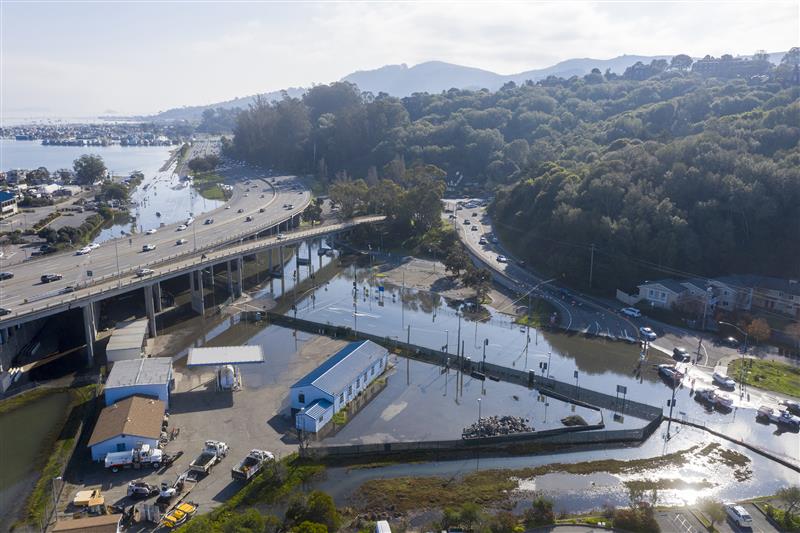
Aerial photo of the king tide at Manzanita Junction, Mill Valley. Water levels were higher than normal due to a perigean spring tide.
Photo Credit: California Coast Commission, 12/4/2021.
Location: Manzanita Junction, Mill Valley, CA
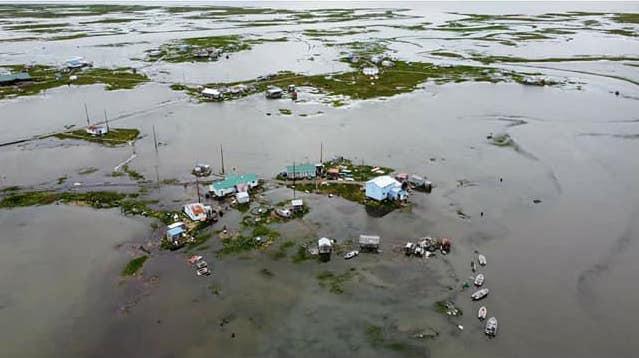
An aerial view of the flooding during an above normal high tide in Kwigillingok.
Photo Credit: Jesse Igkurak, 6/24/2021.
Location: Kwigillingok, Bering Sea Coast, AK
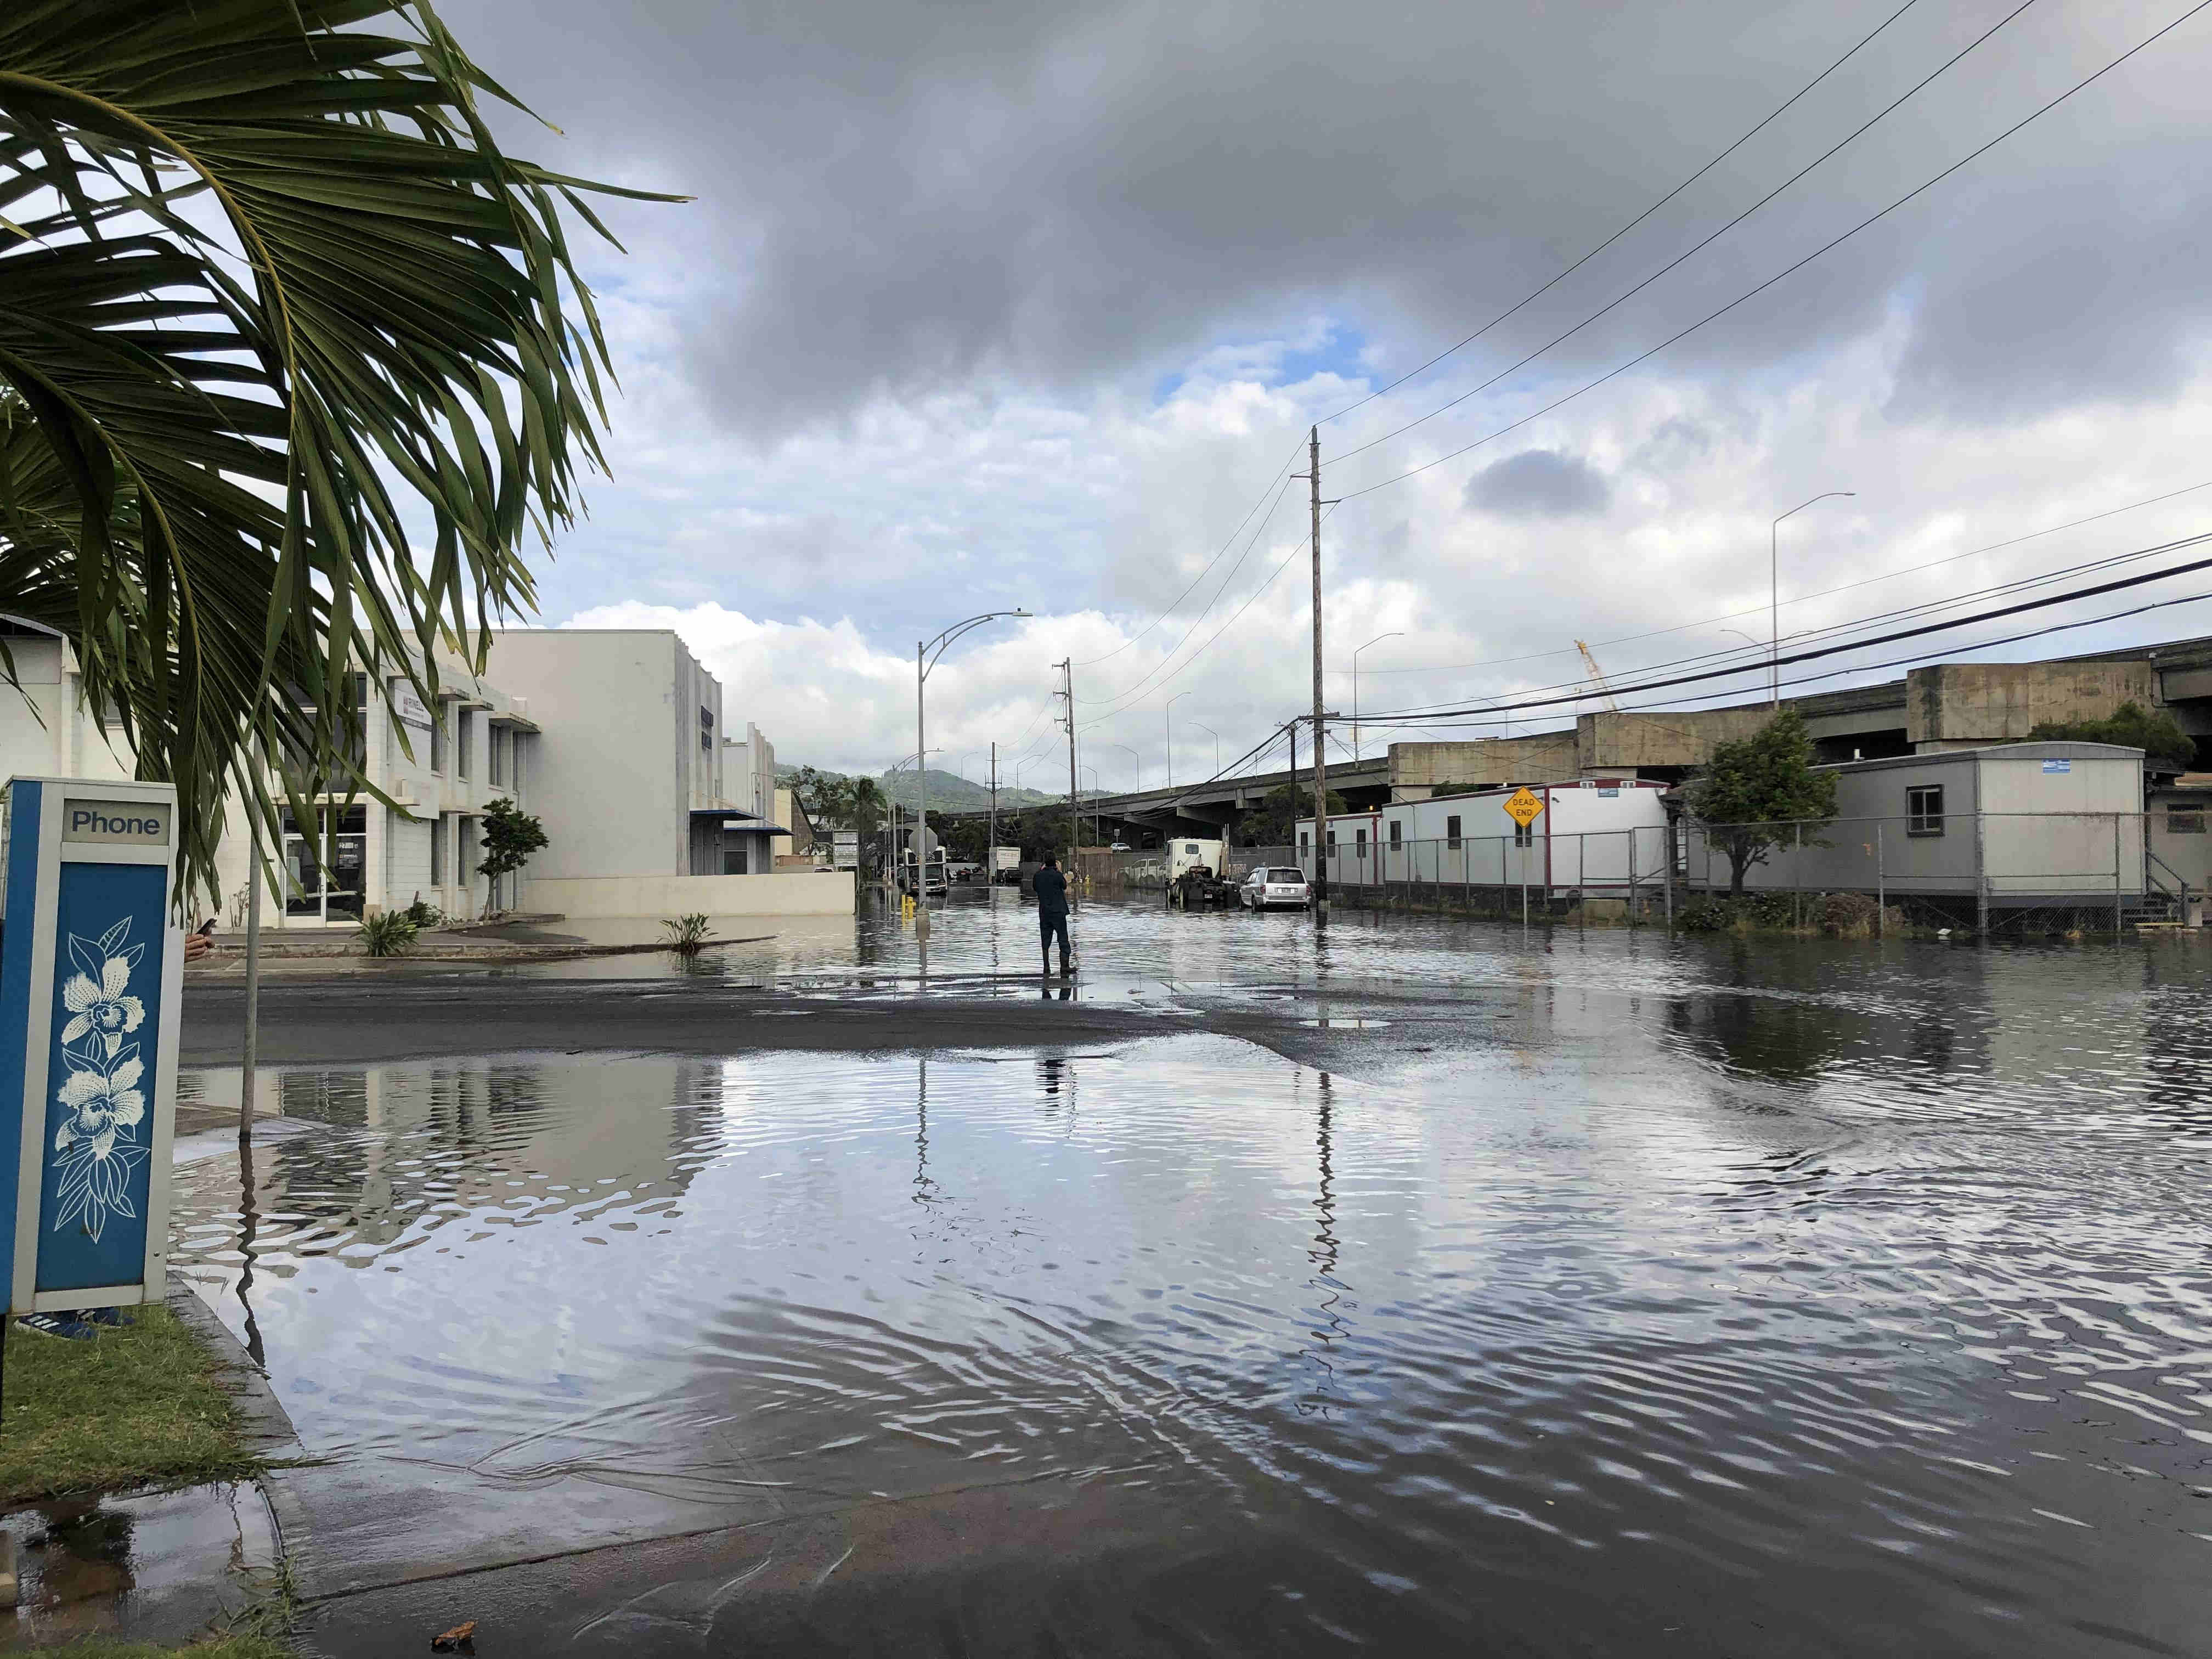
The intersection of Kilihau street and Kakoi street is flooded with water during high tide. Above normal water levels were due to a perigean spring tide and swells from Hurricane Erick.
Photo Credit: kingtide@hawaii.edu, 8/1/2019.
Location: Mapunapuna, HI
No Station Selected []
Coastal Flood Likelihood:
- Unlikely
- Possible
- Likely
Moon Phase:
- New Moon
- Full Moon
- Perigee

- Percentages represent the daily likelihood that a higher than normal high tide may lead to at least minor coastal flooding in flood prone areas.
- Tides tend to be higher on and around the dates of the full and new moon.
- NOAA Tide Predictions for high tides are given to help anticipate when tidally-driven flooding may occur, though exact timing of peak water levels depends on real-time weather conditions.
- Real-time weather conditions may still cause flooding outside of dates identified in this product. Within 5 days, refer to the National Weather Service for forecasts of potential flooding.
About the Monthly Outlook
Visualize when and where above-normal high tides and high tide flooding, may be experienced up to a year in advance. Coastal flooding likelihoods are derived from tide predictions, sea level rise trends, and seasonal changes in coastal sea level. Likelihoods represent the potential that a higher than normal high tide may lead to at least minor coastal flooding in flood prone areas. Real-time weather conditions may still cause flooding outside of dates identified in this product. To monitor water levels in real-time and track storms, visit our Coastal Inundation Dashboard.
Using This Product
Select a region from the drop-down menu above the map or click a station pin on the map and select a month.
- Map: Visualize where high tide flooding is predicted to occur at National Ocean Service (NOS) water level stations in the selected month (default is the current month). Stations are represented by pins color-coded to show flooding likelihoods.
- Region Tab: Learn why tides may be higher than usual in the selected region and what coastal flooding impacts the region may experience as a result of its unique geographic characteristics.
- Calendar Tab: Use the flooding likelihood calendar to identify when high tide flooding is probable at the selected location. Switch on the 12 Month Outlook View with the toggle button.
- Seasonal Tab: Visualize what times of year flooding has been most frequent.
Be advised: Users between tide stations may infer likelihoods from nearby pins, but data is specific to NOS water level station locations and actual likelihoods between stations will vary.
Related Resources
- Guided Animation: High Tide Flooding
- NOS Ocean Fact: Perigean Spring Tides
- Video (1-minute) & NOS Ocean Fact: What is High Tide Flooding
- Seasonal High Tide Bulletin Archive: Summer 2016 – Spring 2023
Technical Documentation
- 2023 Notice of Methodology Update
- GitHub Repository
- Dusek, G., W.V. Sweet, M.J. Widlansky, P.R. Thompson, and J.J. Marra. 2022: A novel statistical approach to predict seasonal high tide flooding. Frontiers Mar Sci. 9. Accessible at : https://www.frontiersin.org/articles/10.3389/fmars.2022.1073792