U.S. Sea Level Trend Map
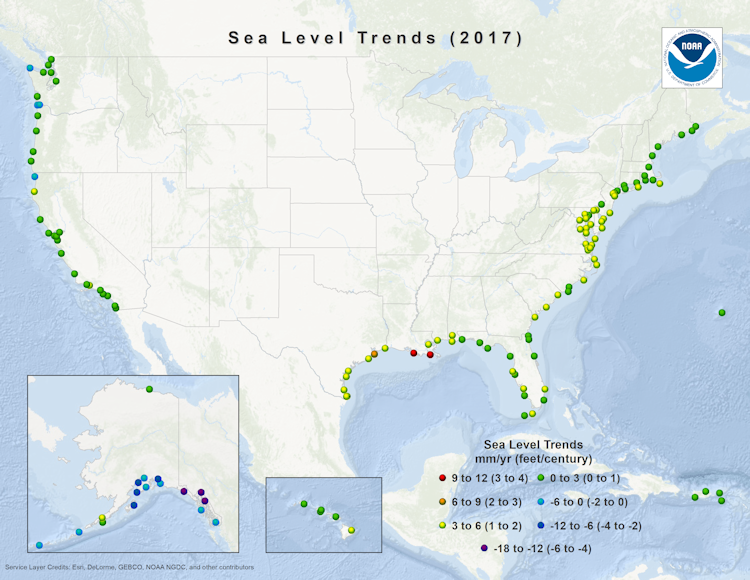
The map of relative sea level trends provides an overview of variations in the rates of local sea level change at long-term tide stations (based on a minimum of 30 years of data in order to account for long-term sea level variations and reduce errors in computing sea level trends based on monthly mean sea level). The variations in sea level trends seen here primarily reflect differences in rates and sources of vertical land motion. Areas experiencing little-to-no change in relative sea level are illustrated in green, including stations consistent with average global sea level rise rate of 1.7-1.8 mm/yr. These are stations not experiencing significant vertical land motion. Stations illustrated with positive sea level trends (yellow-to-red) are experiencing both global sea level rise, and lowering or sinking of the local land, causing an apparently exaggerated rate of relative sea level rise. Stations illustrated with negative trends (blue-to-purple) are experiencing global sea level rise and a greater vertical rise in the local land, causing an apparent decrease in relative sea level. These rates of relative sea level rise reflect actual observations and must be accounted for in any coastal planning or engineering applications.
In addition to variations from specific location-to-location, there are also regional differences. For example, a broad region of the mid-Atlantic coastline along the United States is sinking slowly due to the glacial rebound effect of the uplift of the Hudson Bay region since the end of the last ice age. The Mississippi delta region of Louisiana is rapidly sinking due to the loading of the lithosphere and compaction of the sediments deposited by the Mississippi River. The Texas coastline is also sinking, likely due to similar causes, in addition to oil and gas extraction. The volcanically active Island of Hawaii is sinking relative to the other islands in the Hawaiian chain. Some areas of the northern California, Oregon, and Washington coastline are rising slowly due to the tectonic effects of subduction beneath the North American continent. Rapid uplift in southeastern Alaska is believed to be due to the melting of mountain glaciers. The sea level trends for tide stations in southern Alaska and on the Aleutian islands were calculated based only on data since the major earthquakes in March 1964 and March 1957, respectively. The trends show rapid post-earthquake tectonic uplift at most locations.