Frequently Asked Questons
What is Sea Level?
There is an important distinction between the global sea level trend and relative sea level trends (based on local sea level measurements), which must be understood in order to interpret changes to a coastline or particular location, and to properly apply the information.
Just as the surface of the Earth is not flat, the surface of the oceans is also not flat, and this sea surface is not changing at the same rate globally. For instance, it is known that the absolute water level height is higher along the West Coast of the United States than the East Coast. However, publications often refer to Global Sea Level, or the average height of all the Earth's oceans. "Global Sea Level Rise" refers to the increase currently observed in the average Global Sea Level Trend, which is primarily attributed to changes in ocean volume due to two factors: ice melt and thermal expansion. Melting of glaciers and continental ice masses, such as the Greenland ice sheet, which are linked to changes in atmospheric temperature, can contribute significant amounts of freshwater input to the Earth's oceans. Additionally, a steady increase in global atmospheric temperature creates an expansion of saline sea water (i.e., salt water) molecules (called thermal expansion), thereby increasing ocean volume. The Intergovernmental Panel on Climate Change (IPCC) Report estimates that the global sea level rise was approximately 1.7-1.8 millimeters per year (mm/yr) over the past century (IPCC, 2007), based on tide station measurements around the world, with projected increased trends in sea level in the 20th Century based on global climate models.
Tide stations measure Local Sea Level, which refers to the height of the water as measured along the coast relative to a specific point on land. Water level measurements at tide stations are referenced to stable vertical points (or bench marks) on the land and a known relationship is established. However, the measurements at any given tide station include both global sea level rise and vertical land motion, such as subsidence, glacial rebound, or large-scale tectonic motion. Because the heights of both the land and the water are changing, the land-water interface can vary spatially and temporally and must be defined over time. Depending on the rates of vertical land motion relative to changes in sea level, observed local sea level trends may differ greatly from the average rate of global sea level rise, and vary widely from one location to the next. For instance, in areas of the northern Gulf of America where significant subsidence is occurring, relative sea level trends reflect an increase of greater than 10 mm/yr in some locations, while areas of southeastern Alaska reflect a decrease in relative sea level because the region is dominated by isostatic rebound, or regional uplift of the land caused by the retreat of the glaciers. Relative Sea Level Trends reflect changes in local sea level over time and are typically the most critical sea level trend for many coastal applications, including coastal mapping, marine boundary delineation, coastal zone management, coastal engineering, sustainable habitat restoration design, and the general public enjoying their favorite beach. This website focuses on relative sea level trends, computed from monthly averages of hourly water levels observed at specific tide stations, called monthly mean sea level.
The term Mean Sea Level (MSL) can also refer to a tidal datum, or frame of vertical reference defined by a specific phase of the tide. Tidal datums are locally-derived based on observations at a tide station, and are typically computed over a 19-year period, known as the National Tidal Datum Epoch (NTDE). The present 19-year reference period used by NOAA is the 1983-2001 NTDE. Tidal datums must be updated at least every 20-25 years due to global sea level rise. Some stations are more frequently updated due to high relative sea level trends. Tidal datums are the basis of marine boundaries, are used as a vertical reference plane in producing nautical charts, and provide important baseline information for observing changes in sea level over time. MSL as a tidal datum is computed as a mean of hourly water level heights observed over 19-years. Monthly means are generated in the datum calculation process, which are used to generate the relative local sea level trends observed here. Click here for more information on tidal datums.
Why does Sea Level change over time?
There are a number of factors that contribute to long and short-term variations in sea level. Short-term variations generally occur on a daily basis and include waves, tides, or specific flood events, such as those associated with a winter snow melt, or hurricane or other coastal storm. Long-term variations in sea level occur over various time scales, from monthly to several years, and may be repeatable cycles, gradual trends, or intermittent anomalies. Seasonal weather patterns, variations in the Earth's declination, changes in coastal and ocean circulation, anthropogenic influences (such as dredging), vertical land motion, and the El Niño Southern Oscillation are just a few of the many factors influencing changes in sea level over time. When estimating sea level trends, a minimum of 30 years of data are used in order to account for long-term sea level variations and reduce errors in computing sea level trends based on monthly mean sea level. Accounting for repeatable, predictable cycles, such as tidal, seasonal, and interannual variations allows computation of a more accurate long-term sea level trend.
What does Sea Level have to do with Climate?
Understanding trends in sea level, as well as the relationship between global and local sea level, provides critical information about the impacts of the Earth's climate on our oceans and atmosphere. Changes in sea level are directly linked to a number of atmospheric and oceanic processes. Changes in global temperatures, hydrologic cycles, coverage of glaciers and ice sheets, and storm frequency and intensity are examples of known effects of a changing climate, all of which are directly related to, and captured in, long-term sea level records. Sea levels provide an important key to understanding the impact of climate change, not just along our coasts, but around the world. By combining local rates of relative sea level change for a specific area based on observations with projections of global sea level rise (from IPCC, 2007), coastal managers and engineers can begin to analyze and plan for the impacts of sea level rise for long-range planning.
What are the differences between historical and new sea Level trends and confidence intervals?
As more data are collected at water level stations, the linear mean sea level trends can be recalculated each year. The figure compares linear mean sea level trends and 95% confidence intervals calculated with data beginning from a common year and ending in each year since 2006. The values do not indicate the trend in each year, but the trend of the entire data period up to that year.
Although the mean trend may change from year to year, there is no statistically significant difference between the calculated trends if their 95% confidence intervals overlap. Therefore, the most recent calculated trend is not necessarily more accurate than the previous trends; it is merely a little more precise. If several recent years have anomalously high or low water levels, the values may actually move slightly away from the true long-term linear trend.
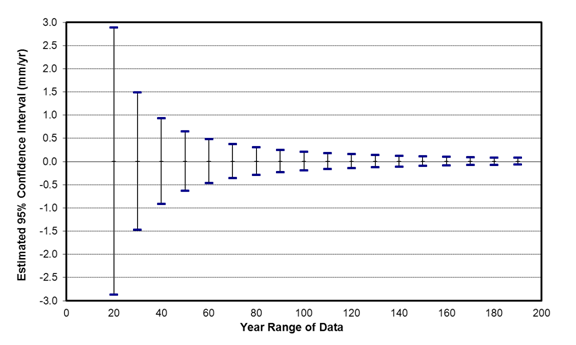
The main effect of including a few more years of data is to narrow the 95% confidence intervals. The figure below (from Sea Level Variations of the United States 1854-2006, NOAA Technical Report NOS CO-OPS 53) shows estimated widths of the 95% confidence intervals derived from all the calculated trends at long-term CO-OPS water level stations. A 30-year data set should provide a trend with a +/- 1.5 mm/yr confidence interval; a 60-year data set should provide a trend with a +/- 0.5 mm/yr confidence interval.