NOAA Current Predictions Help
Navigating to a station
There are two ways to navigate to a station. If you know all or part of the station name, or the station ID, you can simply type the information into the search box on the NOAA Current Predictions home page.

Figure 1: Search box on the NOAA Current Predictions home page
If you do not know the station information, you can search for a station by navigating to the appropriate region or state. This will bring up a list of stations within the selected area. Note that if a station lies within a body of water bordering multiple states, the station will be listed under all appropriate states. For example, stations within the Chesapeake Bay can be found under both Virginia and Maryland.
Within each state or region listing, stations may be grouped by localized regions. These regions may be defined by a specific body of water or local geographical area. In most cases, these are the same regions used in the published Tidal Current Tables. Some regions may also be broken into smaller subregions where necessary. For example, stations within the Thames and Connecticut Rivers can be found within the Long Island Sound grouping.
Understanding the station listing
After searching either manually or by keyword, you will be presented with a listing of stations that matches the search criteria. The below image shows stations that fall under Alabama.
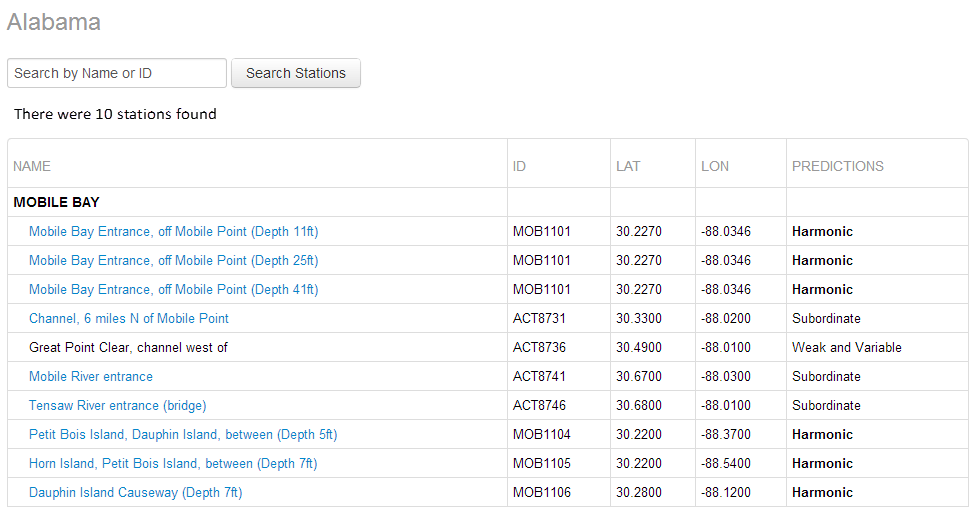
Figure 2: Example of station list when "Alabama" was selected through the application.
Three are 5 columns in the station listing, representing the station name, station ID, latitude, longitude and prediction type.
- Station Name provides a geographical description of the location that the predictions cover and in most cases is the same name listed in the published Tidal Current Tables. For many stations, predictions are available at multiple depths. The representative depth will follow the station name in the listing. For stations with no depth listed, predictions are representative of all depths at the location.
- Station ID is a 7-character station identifier.
- Latitude and Longitude provide a representation of the station location. This location information are listed according to the exactness recorded in the original survey records and thus may be approximate in some instances.
- Predictions describes whether the station is harmonic, subordinate, or weak and variable. Stations designated as Harmonic have predictions calculated directly from harmonic constants derived from an analysis of data collected at that location. Stations designated as Subordinate have predictions calculated at a nearby reference station, where the appropriate time and speed corrections were applied to arrive at accurate predictions at the subordinate station location. Subordinate stations are typically older stations where not enough data were collected to calculate harmonic constants at that location. Stations designated as Weak and Variable have currents that, on average, do not exceed a quarter of a knot. Due to the weak nature of the currents, predictions are not available for these stations.
Understanding the layout of the station prediction page
Once you click on a station within the station listing, you will be taken to a page displaying predicted currents both graphically and in tabular form
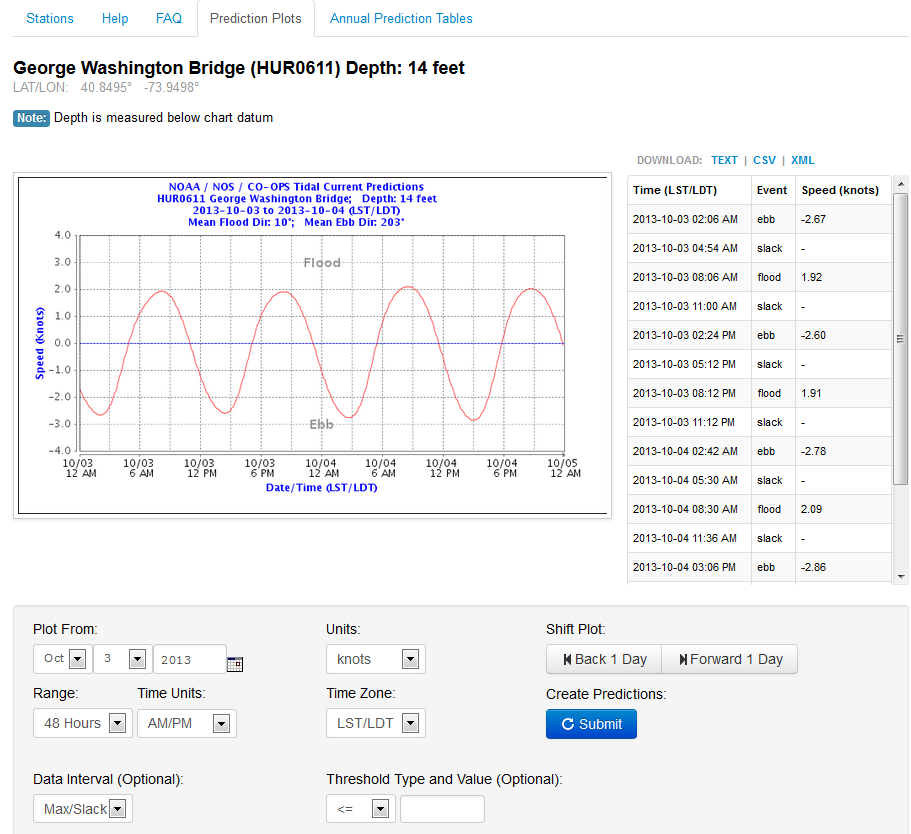
The station name and depth (if available) will be displayed at the top. A 48 hour time-series plot of predictions, beginning at midnight (local daylight time) will be displayed with current speeds displayed in knots. To the right of the plot will be a listing of the time and speed of maximum and slack currents within the prediction period. Above this data listing are links to download the prediction data in Text, CSV, or XML format.
Below the plot, there are several product options that can customize the prediction output, which are listed below:
- Plot From: This is the beginning date for predictions and defaults to today's date.
- Units: Allows you to adjust the speed values between knots (default) and centimeters per second.
- Range: Allows you to toggle between viewing predictions for a 48 hour period (default) or for 1 week.
- Time Units: Adjust between AM/PM time (default) and 24-hour time.
- Time Zone: Adjust between LST/LDT (default), LST and GMT.
- Data Interval: Adjust between Max/Slack output (default) and 6-minute, 30 minute and hourly speed values. This option is available for Harmonic stations only.
- Threshold: Optional parameter that allows you to highlight speeds above or below a user-defined value.
Please note that after changing any product options, you must click Submit for the prediction output to be updated. If you wish to quickly shift the prediction period by a day (or a week for the Weekly range), you can click Back or Forward under "Shift Plot" and the page will adjust automatically.
Understanding the predicted currents output
Current speeds are represented by a speed and direction (relative to True North). The current velocity can also be broken down into 2 components, the "major-axis" speed and the "minor-axis" speed with the two directions orthogonal to one another. In most tidal areas, currents typically flow in one direction during flood and the opposite direction during ebb. This is the major-axis flow. Because the flow across this major axis (the minor-axis flow) is significantly smaller than the flow along the major-axis, expressing the current velocity as a speed component along a set direction gives a good representation of the current velocity at any given time.
The speed values given in this product are the speed along the Mean Flood Direction, which is listed above the time-series plot (see figure 3). Positive speed values indicate that the current is flowing in the direction of the mean flood direction. Negative speed values indicate that the current is flowing in the direction of the mean ebb direction (also listed above the time-series plot in figure 3).
Generating predictions for an entire year
In addition, to being able to view predictions graphically or textually, the application allows you to generate a year of predictions in several different formats. Simply navigate to the station you would like predictions for and click Annual Prediction Tables at the top of the page (see figure 3). This will bring up a page with options to customize the prediction output (see figure 4).
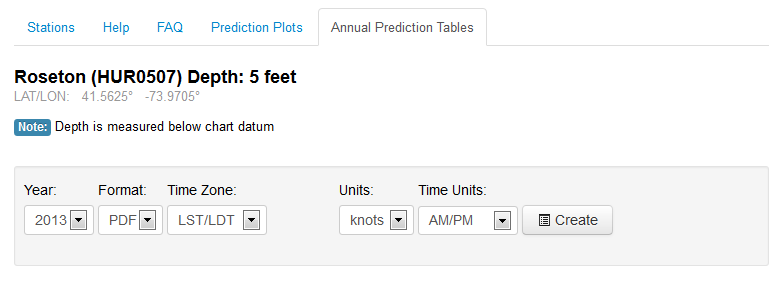
Figure 4: Options for generating a year of predictions. Predictions can be customized and downloaded in PDF, Text, XML or CSV (comma delimited) format.
For the prediction output, you can customize the time zone (LST/LDT, LST, GMT), time units (AM/PM, 24-hour) and speed units (knots, cm/s). The application allows you to download predictions in four different formats, Text, XML, CSV (comma-delimited), and PDF. The PDF option provides predictions in a calendar format similar to reference station predictions in Table 1 of the published Tidal Current Tables (see figure 5). Annual predictions highlight the time and speed of maximum and slack current only.
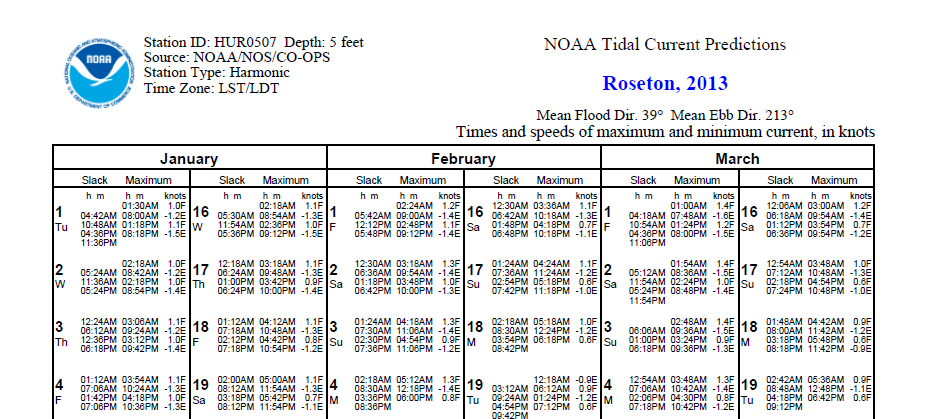
Figure 5: Example PDF output for annual predictions at Roseton at a depth of 5 feet Annual predictions highlight the time and speed of maximum and slack current only.
Updates to NOAA Current Predictions
There are regular updates applied to the NOAA Current Predictions. These updates are applied every quarter; during the first two weeks of January, April, July and October. The quarterly updates may include:
- The addition of new stations
- Changes to the adjustment values and reference station for subordinate stations.
- The removal of superseded stations. These stations may have been replaced by a nearby station which provides more recent (more accurate) data upon which the predictions are based. Some stations may be removed because the available historic data does not allow for accurate predictions.
The number of stations updated and type of updates applied each quarter will vary depending on data collected and analyzed during the quarter.
Back to top