- Extreme Water Levels
- Alabama
- Alaska
- California
- Connecticut
- Delaware
- Florida
- Georgia
- Hawaii
- Louisiana
- Maine
- Maryland
- Massachusetts
- New Jersey
- New York
- North Carolina
- Oregon
- Pennsylvania
- Rhode Island
- South Carolina
- Texas
- Virginia
- Washington
- Washington DC
- Island Stations
- Station Comparisons
- User's Guide
-

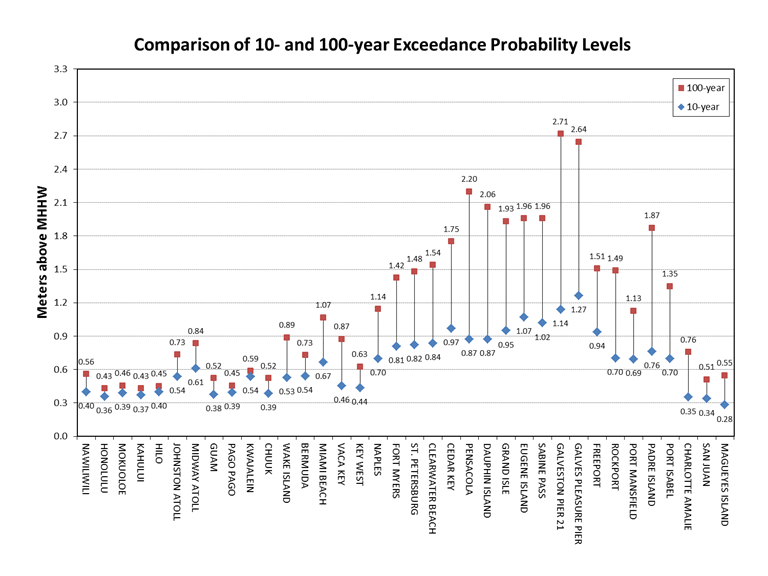
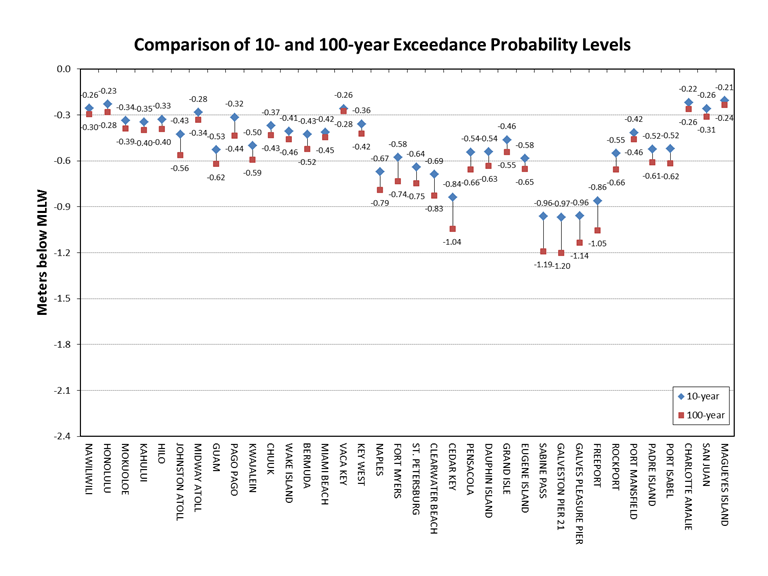
Extreme Exceedance Probability Levels
The graphs compare the 10% and 1% annual exceedance probability levels which correspond to the levels that would be exceeded ten times and one time per century. The high exceedance probability levels are in meters above Mean Higher High Water (MHHW) and the low exceedance probability levels are in meters below Mean Lower Low Water (MLLW).